Thursday, December 29, 2011

Dec 29th Gold - wheres the bottom?

Gold was sold off again today which brought a close of ~$1546.  The $1575 area did not provide much support (Fib 23.6 retracement and May 2nd peak), but when you have more sellers than buyers, the price will drop below significant support levels.  Throw in price manipulation and you can throw technical analysis out the door.  If the players with hundreds of millions of dollars want to make money on the short side, they will push the market down, then eventually go long.  There may also be hedge funds selling to improve (and show) their profits for 2011.

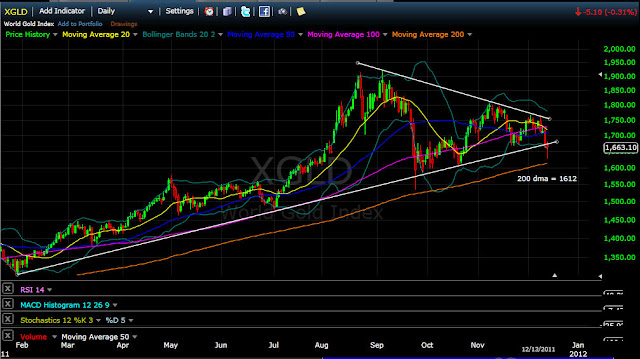
Should the sell off continue, Gold may meet the July 1st low of ~$1478 which would be a 100% retracement of the move up during the summer. It's following the lower Bollinger Band to the downside and beneath the 20, 50, 100 and 200 day moving averages. (It is trading $75 below the 200 day moving average)

The MF Global fiasco may be influencing the futures markets in some way...?  If your a futures trader and know that your clearing firm can go bankrupt at any time, take all of the cash in your account, lock you out from your hedged positions for a week, confiscate your Gold / Silver, would you continue to trade in those markets?  And to top if off, the CME, CFTC and your Government will do nothing about it.

Gold is up about ~11.6% for the year which is better than most mutual funds and a savings account that is getting .05%.  The S&P 500 is up about .43% year to date. We may look back at this time and see that Gold was a good buying opportunity.

Wednesday, December 28, 2011

Seeking Alpha article

Here is a link to an article written by J.S. Kim posted on SeekingAlpha on Dec 27th which discussed the MF Global relationship to the price drop with both Gold and Silver.  He also talks about the paper Gold and Silver products GLD, SLV, manipulation, comex default, etc...


http://seekingalpha.com/article/316197-bankers-precious-metals-and-mf-global

Friday, December 23, 2011

Silver - bearish

In 2010, Silver was up about 75%, 2011 year to date Silver is currently down -1.9%.  (Gold is up around 17.5% ytd)

When looking at the following chart without knowing what symbol it is, most technicians would tell you that it is in a downtrend as the price is trading below all moving averages. (20, 50, 100, 200).  It is also producing lower highs since late April early May of this year.

 The $29 level looks like it has some support, but when large sellers start unloading their positions, lower prices may be in the future (?)  Does the chart above look bullish to you?  It looks like it may be ready to drop another 5 bucks...  (Check the double short Silver ZSL for any unusually high volume which may be an indicator that the crooks at the CME, CFTC and bullion banks are loading up before they sell off their futures contracts).

Here is a weekly chart of Silver (log scale) going back to 2003 with upper and lower trend lines indicating the long term trend:


Silver broke below the lower trend line in 2008 and it took close to 2 full years to break back above it.  Silver now has pierced the trend line again with the latest sell-off and sideways action.  What does this mean?  Short to mid term downtrend / bearish, long term bullish.

Even if there is a shortage in the physical market, the crooks can still manipulate the spot price down as they can throw hundreds of million of digital fiat 'money' to knock the price down. (Counterfeited by the Federal Reserve, approved by the U.S. Government). This will come to an end once the Comex runs out of physical metal.

On a lighter note, Happy Holidays to all!

Wednesday, December 21, 2011

Gold still under the 200 dma

Gold is inching its way back to the 200 dma which is currently at 1617.  It may have found support from the peak made in late April, early May 2011.  The MACD Histogram is heading up which may lead to slightly higher prices.


Even with the slight upwards trend, Gold looks like it will consolidate for the remaining 2 weeks of December between ~1575 to ~1650. Gold is currently up about 13.2% for the year.  Silver is down just over 5%.  What other investment is up over 13% for 2011?

Tuesday, December 20, 2011

US Dollar, Bullish?

Here is a daily chart of the US Dollar Index going back to May 2010.  It is easy to see the long term lower highs that was produced over the last 1.5+ years,,,,,at least until last week.

The $81.42 produced last Wednesday took out the last break high of $80.43.  Technically, it is now producing higher highs and higher lows, at least for the short/mid term.  Since the USD is viewed at the 'reserve currency', many people flock to it when all other assets seem very risky.  That is just the way it is and we may see a short term uptrend as people do not know where to put their money.  (Gold is in a bubble right? so why buy it)

It's hard to believe that people want to purchase the USD especially with all of the digital 'money' the Federal Reserve and this government has produced over the last 3 years.  TARP, QE2, Operation Twist, Military Spending Bill (662 Billion), ect...    It's just a matter of time before it reverses the trend and starts producing lower lows and lower highs.  Do you think inflation is bad now?  Just wait a few more years...

Monday, December 19, 2011

Gold Silver Ratio, PM flat markets

The Gold Silver ratio is heading towards the top of the range and is currently at 55:1.  The RSI is on an upwards trend and the ratio is also trading above the 20 and 50 dma.  Silvers first trading day of this year closed at $30.67, if it does not rally higher than that within the next 2 weeks, it will be a negative return for 2011.  (And it got up to $49.82! in April).


On a positive note, here is an interview with David Morgan, he sees a potential $60 Silver and $2500 Gold for 2012:

Saturday, December 17, 2011

Gold & Silver Stocks, someones buying a few shares...

The spot prices of Gold and Silver have been in a bearish trend over the last several months and especially this last week.  The Gold and Silver miners have followed suit and have dropped as well.  Last Thursday and Friday, some entity is purchasing select Gold and Silver stocks as the volume was double, triple, 4x + the daily average.

Contrarian investors want to get in when others are getting out and want no part of the investment. These types of investors are very successful, Rick Rule comes to mind.  (Maybe James Dines too)

Here are a few of the mining stocks that I noticed with higher than average volume on 12/15-16/2011:  (See green arrow pointing at the last few volume bars)

Alexco Resource

First Majestic Silver

Aurico Gold (Silver too)

Allied Nevada Gold

Richmont Mines

US Gold Corp

Midway Gold Corp

Is it a hedge fund loading up for a swing trade? (Anticipating a run-up into the 1st quarter of 2012?)  Sprott Asset Management?  Tocqueville? Casey Research? One of the Gold/Silver mutual funds like the Fidelity Select Gold Portfolio?  Goldman Sachs?  JPM?

In any case, it looks like someone with fairly deep pockets is speculating on select Gold and Silver miners and that a early 2012 rally may be in their 'crystal ball'...

Disclosure: At the time of this post, the author owns shares long of Alexco Resources.


Wednesday, December 14, 2011

Gold Dec 14th, 2011 - Bearish

Daily chart of the World Gold Index for Dec 14th, 2011.  Down $72 and change in today's trading to $1591.


The wedge pattern was pierced to the downside and has gone through the 200 dma.  As mentioned in yesterdays post, when Gold has touched the 200 dma over the past 10 years, it has been a buy.  It went below the 200 dma in the 2008 financial crises where all investors sold off just about everything they held onto. Many needed to liquidate due to margin calls.  Will the European debt issue cause the same effect?

I personally believe that some large players (banks) want to exchange their fiat into Gold. (Especially when there is so much of the stuff sloshing around in the system due to TARP and QE2)  If you are going to purchase a large amount of Gold, do you want to purchase it at $1850 or at $1550 and ounce?  

They can start a sell off and cause others to liquidate their positions which will drive the price lower.  They can then be able to purchase Gold at lower prices.  So here is your chance to exchange paper/cotton fiat for a real asset.  

There may be another day or two of lower prices, but it may be a sharp drop lower to a spike back up.  It is difficult to time the market as most people are working during the day and cannot head down to the local coin dealer.  (Buying ETF's or mining shares is much easier these days with a simple click of a mouse button).  Stay long and do not worry, in 6 months, Gold may make new all time highs.


Tuesday, December 13, 2011

Gold Dec 13th short term bearish

World Gold Index for Dec 13th, 2011.  The wedge pattern was pierced to the downside today and may be heading towards the 200 day moving average of 1612.  If you look over the past 10 years of how Gold has traded, it has been a buying opportunity each time it has reached the 200 dma.


10 year chart courtesy of Kitco.com, the green line is the 200 dma, blue is a 60 dma.


The average Gold price appreciation over the last 10 years is around ~17%.  As of today, Gold is up approximately 19.7%.  It is trading 2.7% above the last 10 year average.

Should Gold continue to trend down below the 200 dma, it may be a good time to accumulate and add to your current position.  (We need to find more fiat paper to exchange!) 

Monday, December 12, 2011

Dec 2011 Gold / HUI

Gold is still in a trading range and within the wedge pattern which is coming closer to a point.

Gold is down today and as of this writing, it is off -$47.50 at $1665 which is near the bottom of the lower trend line. It's below the short, mid and 100 day moving averages.  Technically, it's in a bearish downtrend with lower highs and lower lows since the $1900+ peak that was reached in September.

I listened to one trader that mentioned December 15th would start an uptrend into the 2012 year based on 'Longwave' cycles and fibonacci retracements.  I'm not sure how some of these guys can predict the exact day an uptrend with occur with those 'tools', but if I could predict what tomorrow would bring, I'd be a billionaire.

The HUI Gold Bugs Index continues within a trading range and looks like it will remain within the blue box for the remainder of 2011. (Only 2 trading weeks left).


The fibonacci projection is up to the ~735 area from the current price of ~537 which would be a nice move for all solid Gold and Silver producers. Baring any major stock market declines/crashes that would take these stocks along for the ride, a breakout to the upside may occur within the 1st half of 2012.

Saturday, December 10, 2011

Silver = Trading range

Silver has been in a trading range since the last drop and announcement of the 'twist' program from the Federal Reserve.  It's currently trading under the short, mid and long term moving averages which is technically bearish.


You can see the 3 trading ranges indicated with the boxes since the Comex margin increases last May.  Fundamentally, Silver should break towards the upside with the debt issues in both Europe and the US.  But as well all know, the spot price is derived from the futures market and the individuals with the most money sets the prices in the short / mid term.

Bottom line is that it is very hard to determine which way it will break after this consolidation period.  Investors may have to wait until January to find out.

Tuesday, December 6, 2011

Jim Rodgers on CNBC

Jim visiting the NYSE and talks to Maria about the markets, debt, commodities, Europe and the US>

Monday, December 5, 2011

Waiting for Gold and Silver stocks to move up

is like watching paint dry over the last year plus.  Here is a weekly chart of the Amex HUI Gold bugs index which is in a consolidating range. (Blue box)

Major upper and lower trend lines are seen with the index in a long term uptrend. A fibonacci retracement is drawn from the 2003 rally.

The HUI has been in a consolidating range just over the fibonacci 261.8 level and will be approaching the lower trend line early next year.  If Gold moves to the upside in the first quarter of the year, Gold stocks may follow and send the HUI to the next fibonacci level of 423.6 or ~735.  (Currently at 561)

A move to the ~735 area on the HUI should move most Gold and Silver producers to the upside and to the next fib level on their respective charts.  All bets are off should the European debt crises crash the worldwide financial markets...  (Fundamentally, both Gold and Silver should go up with the current debt issues and the mining stocks should follow.  But with high frequency trading, hedge funds, leverage, manipulation, etc... you never know whats going to happen).

Saturday, December 3, 2011

Gold SIlver Ratio - Trading range

The Gold Silver Ratio has been in a trading range and will most likely continue until one of the metals makes a move either up or down with the other flat or moving in the opposite direction.

Here is a two year chart of the ratio with a 20 and 50 day moving average. I've placed Blue lines indicating the top, bottom and right in the middle for an estimated 50% level. 

One can make the argument that it is on an ascent and the ratio may be heading higher.  It's definetly on an upwards path of higher (from May 2011) , consolidation (Green boxes), higher, consolidation, ???   It's above the 50dma and also above the 50% retracement of the last significant move.

If Gold should move to the upside, it will pull Silver along with it.  If they appreciate at the same rate, we'll have a flat ratio.  It's a matter of time before Silver starts another rally to the upside and appreciate at a faster rate than Gold, maybe next year, maybe 2013?  Until then, expect Silver to lag / follow Gold's path whichever it may be.

Many expect the ratio to be under 20/1 at the final parabolic phase of the bull market.  That is why many people invest in this particular precious metal.  The downside is that it is much more volitile than Gold   With Gold currently trading at $1747 and ounce, a 20/1 ratio would put Silver at $87.35 an ounce. (Corrected Dec 21st from 78.40, error noticed by a reader) 

One can argue that you will be more than doubling your capital within the coming years by investing in Silver when it reaches a 20/1 ratio.  Not a bad return considering that a saving account is less than 1%.

Thursday, December 1, 2011

MF Global Fiasco

Listen to Jim Puplava interview Anna Barnhardt about the MF Global bankruptcy and John Corzine.

How is this guy NOT IN JAIL ? ? ?  (We know why, but STILL...  If you or I walked into a store and stole $500, we would be put in handcuffs and thrown in jail.  This guy stole over 1 BILLION and is out walking the streets...

Click here for the interview