Sunday, March 31, 2013

Will April be better???

Weekly Gold chart going back to late 2004, consolidations are boxed in white.  You can see that these consolidations have been well over 1 year period of time.  The box between 2010 and 2011 is not a true consolidation as the price drifted upwards during that time.

The current price is closest it has been to the 200 week moving average since the 2008 financial meltdown.  Can it consolidate more?  Gold may drop to the bottom of the range before going for a run to the top of the range.  Maybe April will be a better month?

Weekly Silver chart going back to 2004 with major trend lines in blue showing a double upwards channel. The parabolic spikes are clearly seen with major sell offs right after.

Silver has been in a major consolidation period since the sell off in May 2011. Short term, it is bearish as it's trading below all of the moving averages, 20, 50, 100 and 200.  It has also breached the major bottom trend line which is not a bullish sign.

With Cyprus in the news, I would think that more people would become aware of what central banks around the world are doing. (Debasing and stealing for their own benefit at the expense of the people)

If Silver does not get a decent bid in April, expect more of the same trading range going forward. I would not be surprised to see $26 again for the 5th time?

With the Fed and their magic money machine (Digital is their weapon of choice), they can continuously supply the too big to fail banks with digital fiat to suppress the price on the Comex.  Based on what I've seen over the years, I believe that the _cartel_ is stronger than most people think. IMO, they will fight this particular commodity down to the last day, expect a slow grind going forward.  (Unless they decide to make a few $$$ going long before shorting it again).

Tuesday, March 19, 2013

Silver: Breakout or breakdown?

3 year weekly chart of Silver (SLV in this case)


Observations: If the silver price continues to trade sideways to slightly up, the recent RSI low is higher than the previous low set around June last year. This gives the chart a rising RSI on a weekly basis. (If the price hold up)

The Silver price is clearly in a downtrend with support around the $26 level. A declining price with a rising RSI is a divergence in the short to mid term, this eventually suggests that the price will eventually rise, but when?  No one really knows for sure.

The weekly slow stocastics are oversold and may be at the beginning of a bullish D/K crossover.

Also noted is that the Silver price is closest to the 200dma since Feb 2010, over 3 years ago. (Not shown on the chart) The price at that time was in a one month downtrend, then returned to trade around the $18 level and six months later started the massive rise to 48+ into 2011.

Fundamentally and in my opinion, Silver is grossly undervalued.  Based on the US money supply, industrial demand, investor demand and the amount that is mined every year. 

With the Cyprus banking news (fiasco/robbery), many people in the European community may become a bit wary of their currency and where they keep their 'money'. This may be a hint of things to come with other countries??? Those that are proactive may be seeking a safe place to put their 'money' which is bullish for the precious metals. 

Monday, March 11, 2013

Silver ready for a bounce?

Here are my observations on the technical's of the Silver market at this time. It has been in a consolidation period since the blow off of 5/11 which will be almost 2 years.

Weekly Silver chart from Jan, 2011.

Indicators on this chart (I know it is a bit 'busy'):
Moving averages of 20, 50, 100 and 200.
Fibonacci from the last low just over $26 to the last high around $35.
Bollinger band
Major long term trend lines in light blue (Double channel)
Mid term trend line in white

Ready for a bounce???  Silver is rising out of an oversold area on the Slow Stocastics, off of the bottom of the 23.6 fibonacci retracement level and rising after bouncing off the lower trend line which is now support. (At least for the time being)

If you look at the yearly price of Silver over the last few years, it has often put in the lowest price during the first 3-4 months of the year.  Based on that, we may have seen the low price of the year already....?

I'm looking for a bounce back up near the upper trend line. (Another lower trend line is not drawn which is near the $31 level.  Resistance levels at the 20 day moving average of $29.40, fibonacci level 38.2 around $29.75, 50 day moving average at $30.60 and the 50% fibonacci retracement of $30.80.

I picked up some 'paper' Silver last week and the week before for a swing trade. You can take a percentage of profits from the paper trades and purchase physical. As many people do, dollar cost average into the metals.

Weekly Silver from 2003
The longer term Silver chart has a double upwards channel in light blue. The lower channel was just pierced which IMO makes the Silver metal undervalued just like in 2008. David Morgan has mentioned that price 'manipulation or management' can be done in the short to mid term,  but cannot be done over the long term. Well, if that is the case and you believe it, Silver is a pretty good buy if you are a contrarian investor.

Lastly on this chart is a timeline fibonacci that is started on the 5/06 spike high to the low in 11/08. The has projected a date around 4/11 which was the parabolic spike high of $49.  The next date (not shown on this chart) is near the end of Oct 13 or start of Nov 13.  Based on the fibonacci timeline, something 'big' is going to happen near this time, we shall see.........

Tuesday, March 5, 2013

Gold 1.5 year trading range+

Hello,

I'll start updating this blog once, maybe twice a week for those that want to drop by and see/read some general analysis on the PM markets.   I had (and still have) a problem with Google's adsense program which halted my interest in blogging for a while.

Here is a 3 year weekly chart of Gold which has been in a trading range since the mid to latter part of 2012. In the short term, it is still in a technical downtrend as the RSI is heading down, the MACD is under the centerline and the Slow Stochastics K line is under the D line and is in over sold area.


I continue to hold onto a core physical metal (Silver) and have a swing trading account. Over the last 1.5 years in the Gold / Silver market, only the 'traders' have made any fiat $ in these markets. Pro traders are making money going both long and short which is easy to do with inverse ETF's like AGQ for Silver, DZZ & GLL for Gold and DUST for the miners. (Most people are not going short on PM futures contracts)

With this long consolidation, I expect a rally at some point this year...?  Summer?  Fall?  I heard one guy on CNBC this morning in which he stated that Gold will be lower by the end of the year.  The fed last week mentioned that it may end QE earlier than expected as the economy gets stronger.  I'm with Peter Schiff who has stated that the Fed will not stop their fiat printing drug addiction.

Tuesday, June 19, 2012

Six Billion Dollar Bet

Six Billion Dollar Bet

He should have invested ib Gold and Silver....
Watch Six Billion Dollar Bet on PBS. See more from FRONTLINE.

Tuesday, June 5, 2012

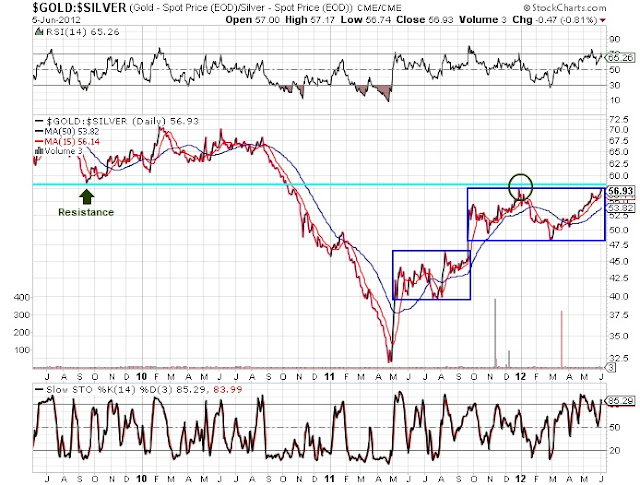
Gold Silver Ratio at upper end of range

The Gold Silver Ratio is currently around the 56-57 area which many would consider high based on the coinage act of 1792. (The Act defined the proportional value of gold and silver as 15 units of pure silver to 1 unit of pure gold.)  The ratio of Gold to Silver in the earths crust is somewhere between 15 and 20 to one, I've read that it was 18-1.
So, if one believes that the Gold Silver Ratio will eventually go down possibly under 20-1, this may be a good opportunity to accumulate or add to your position. That is if you are going to hold long term. (Which IMO is over a year and may be another 5 years for this commodity bull market).

Can the ratio go higher?  Sure, possibly 60+ depending upon how speculators see the economy as Silver is tied to an industrial metal.  Economy is bad, less demand for the metal...  at least that is how the street sees it.


Gold rallied huge last Friday and was up quite a bit more than Silver. Speculators will flock into Gold in uncertain times and will generally stay away from it's volatile brother, Silver. Gold is currently leading with Silver following.

The 56 ratio is trading near the recent top produced in late Dec, 2011.  Will a double top be produced? Both RSI and Stochastics are overbought and suggest a possible reversal to the downside. There should be major resistance to the upside just under the 60 level as noted by the low point in Sept 2009.


Sunday, June 3, 2012

Summer Rally?

Nice move in the precious metals markets on Friday June 1st due to the jobs report and the ongoing issues with Greece / Europe.

Gold was up ~$59 for the day and stopped right at the 50 day moving average. RSI and Stochastics were oversold and are heading towards the overbought area.  Technical swing traders may pile in paper gold to continue the push up.
Could May be the low for the year?  Possibly, but you just never know for sure.  Gold was trading near the bottom of the large range that was produced last year between July and early September. It will be a little while for it to pierce the 200 dma and then a crossover of the 50 over the 200.


Silver did not move as much as Gold as it was pulled up because Gold went up. Gold led, Silver followed.  When you have the RSI and Stochastics both in oversold area at the same time, there is a good chance for the investment to move towards the upside. That was the case here, but Silver still needs more speculators to invest for a stronger move to the upside.

The low produced in May was higher than the low produced at the end of 2011 which is a good sign. (Higher lows)


The Gold Bugs Index HUI had a nice day up 6.74% and over the 50dma.  Again, the RSI and Stochastics were both in the oversold area and a reversal to the upside was produced. A push over the 100 and 200dma may signal trading algorithms to take positions in the senior and mid tier miners.

The miners are trading at historic low PE's and speculators/traders are taking positions at these low prices. The street still has faith in the Gold and Silver miners as they were up as a whole while the Dow and S&P were hammered on Friday. (A very good sign)

Swing trading the GDX and GDXJ may be of interest to those that have a side trading account. (Aside from the core physical position)