Thursday, December 29, 2011

Dec 29th Gold - wheres the bottom?

Gold was sold off again today which brought a close of ~$1546.  The $1575 area did not provide much support (Fib 23.6 retracement and May 2nd peak), but when you have more sellers than buyers, the price will drop below significant support levels.  Throw in price manipulation and you can throw technical analysis out the door.  If the players with hundreds of millions of dollars want to make money on the short side, they will push the market down, then eventually go long.  There may also be hedge funds selling to improve (and show) their profits for 2011.

Should the sell off continue, Gold may meet the July 1st low of ~$1478 which would be a 100% retracement of the move up during the summer. It's following the lower Bollinger Band to the downside and beneath the 20, 50, 100 and 200 day moving averages. (It is trading $75 below the 200 day moving average)

The MF Global fiasco may be influencing the futures markets in some way...?  If your a futures trader and know that your clearing firm can go bankrupt at any time, take all of the cash in your account, lock you out from your hedged positions for a week, confiscate your Gold / Silver, would you continue to trade in those markets?  And to top if off, the CME, CFTC and your Government will do nothing about it.

Gold is up about ~11.6% for the year which is better than most mutual funds and a savings account that is getting .05%.  The S&P 500 is up about .43% year to date. We may look back at this time and see that Gold was a good buying opportunity.

Wednesday, December 28, 2011

Seeking Alpha article

Here is a link to an article written by J.S. Kim posted on SeekingAlpha on Dec 27th which discussed the MF Global relationship to the price drop with both Gold and Silver.  He also talks about the paper Gold and Silver products GLD, SLV, manipulation, comex default, etc...


http://seekingalpha.com/article/316197-bankers-precious-metals-and-mf-global

Friday, December 23, 2011

Silver - bearish

In 2010, Silver was up about 75%, 2011 year to date Silver is currently down -1.9%.  (Gold is up around 17.5% ytd)

When looking at the following chart without knowing what symbol it is, most technicians would tell you that it is in a downtrend as the price is trading below all moving averages. (20, 50, 100, 200).  It is also producing lower highs since late April early May of this year.

 The $29 level looks like it has some support, but when large sellers start unloading their positions, lower prices may be in the future (?)  Does the chart above look bullish to you?  It looks like it may be ready to drop another 5 bucks...  (Check the double short Silver ZSL for any unusually high volume which may be an indicator that the crooks at the CME, CFTC and bullion banks are loading up before they sell off their futures contracts).

Here is a weekly chart of Silver (log scale) going back to 2003 with upper and lower trend lines indicating the long term trend:


Silver broke below the lower trend line in 2008 and it took close to 2 full years to break back above it.  Silver now has pierced the trend line again with the latest sell-off and sideways action.  What does this mean?  Short to mid term downtrend / bearish, long term bullish.

Even if there is a shortage in the physical market, the crooks can still manipulate the spot price down as they can throw hundreds of million of digital fiat 'money' to knock the price down. (Counterfeited by the Federal Reserve, approved by the U.S. Government). This will come to an end once the Comex runs out of physical metal.

On a lighter note, Happy Holidays to all!

Wednesday, December 21, 2011

Gold still under the 200 dma

Gold is inching its way back to the 200 dma which is currently at 1617.  It may have found support from the peak made in late April, early May 2011.  The MACD Histogram is heading up which may lead to slightly higher prices.


Even with the slight upwards trend, Gold looks like it will consolidate for the remaining 2 weeks of December between ~1575 to ~1650. Gold is currently up about 13.2% for the year.  Silver is down just over 5%.  What other investment is up over 13% for 2011?

Tuesday, December 20, 2011

US Dollar, Bullish?

Here is a daily chart of the US Dollar Index going back to May 2010.  It is easy to see the long term lower highs that was produced over the last 1.5+ years,,,,,at least until last week.

The $81.42 produced last Wednesday took out the last break high of $80.43.  Technically, it is now producing higher highs and higher lows, at least for the short/mid term.  Since the USD is viewed at the 'reserve currency', many people flock to it when all other assets seem very risky.  That is just the way it is and we may see a short term uptrend as people do not know where to put their money.  (Gold is in a bubble right? so why buy it)

It's hard to believe that people want to purchase the USD especially with all of the digital 'money' the Federal Reserve and this government has produced over the last 3 years.  TARP, QE2, Operation Twist, Military Spending Bill (662 Billion), ect...    It's just a matter of time before it reverses the trend and starts producing lower lows and lower highs.  Do you think inflation is bad now?  Just wait a few more years...

Monday, December 19, 2011

Gold Silver Ratio, PM flat markets

The Gold Silver ratio is heading towards the top of the range and is currently at 55:1.  The RSI is on an upwards trend and the ratio is also trading above the 20 and 50 dma.  Silvers first trading day of this year closed at $30.67, if it does not rally higher than that within the next 2 weeks, it will be a negative return for 2011.  (And it got up to $49.82! in April).


On a positive note, here is an interview with David Morgan, he sees a potential $60 Silver and $2500 Gold for 2012:

Saturday, December 17, 2011

Gold & Silver Stocks, someones buying a few shares...

The spot prices of Gold and Silver have been in a bearish trend over the last several months and especially this last week.  The Gold and Silver miners have followed suit and have dropped as well.  Last Thursday and Friday, some entity is purchasing select Gold and Silver stocks as the volume was double, triple, 4x + the daily average.

Contrarian investors want to get in when others are getting out and want no part of the investment. These types of investors are very successful, Rick Rule comes to mind.  (Maybe James Dines too)

Here are a few of the mining stocks that I noticed with higher than average volume on 12/15-16/2011:  (See green arrow pointing at the last few volume bars)

Alexco Resource

First Majestic Silver

Aurico Gold (Silver too)

Allied Nevada Gold

Richmont Mines

US Gold Corp

Midway Gold Corp

Is it a hedge fund loading up for a swing trade? (Anticipating a run-up into the 1st quarter of 2012?)  Sprott Asset Management?  Tocqueville? Casey Research? One of the Gold/Silver mutual funds like the Fidelity Select Gold Portfolio?  Goldman Sachs?  JPM?

In any case, it looks like someone with fairly deep pockets is speculating on select Gold and Silver miners and that a early 2012 rally may be in their 'crystal ball'...

Disclosure: At the time of this post, the author owns shares long of Alexco Resources.


Wednesday, December 14, 2011

Gold Dec 14th, 2011 - Bearish

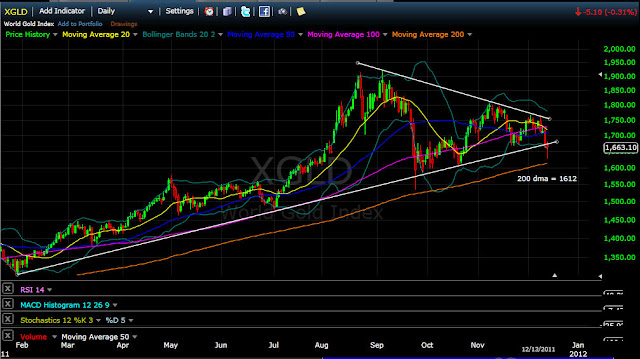
Daily chart of the World Gold Index for Dec 14th, 2011.  Down $72 and change in today's trading to $1591.


The wedge pattern was pierced to the downside and has gone through the 200 dma.  As mentioned in yesterdays post, when Gold has touched the 200 dma over the past 10 years, it has been a buy.  It went below the 200 dma in the 2008 financial crises where all investors sold off just about everything they held onto. Many needed to liquidate due to margin calls.  Will the European debt issue cause the same effect?

I personally believe that some large players (banks) want to exchange their fiat into Gold. (Especially when there is so much of the stuff sloshing around in the system due to TARP and QE2)  If you are going to purchase a large amount of Gold, do you want to purchase it at $1850 or at $1550 and ounce?  

They can start a sell off and cause others to liquidate their positions which will drive the price lower.  They can then be able to purchase Gold at lower prices.  So here is your chance to exchange paper/cotton fiat for a real asset.  

There may be another day or two of lower prices, but it may be a sharp drop lower to a spike back up.  It is difficult to time the market as most people are working during the day and cannot head down to the local coin dealer.  (Buying ETF's or mining shares is much easier these days with a simple click of a mouse button).  Stay long and do not worry, in 6 months, Gold may make new all time highs.


Tuesday, December 13, 2011

Gold Dec 13th short term bearish

World Gold Index for Dec 13th, 2011.  The wedge pattern was pierced to the downside today and may be heading towards the 200 day moving average of 1612.  If you look over the past 10 years of how Gold has traded, it has been a buying opportunity each time it has reached the 200 dma.


10 year chart courtesy of Kitco.com, the green line is the 200 dma, blue is a 60 dma.


The average Gold price appreciation over the last 10 years is around ~17%.  As of today, Gold is up approximately 19.7%.  It is trading 2.7% above the last 10 year average.

Should Gold continue to trend down below the 200 dma, it may be a good time to accumulate and add to your current position.  (We need to find more fiat paper to exchange!) 

Monday, December 12, 2011

Dec 2011 Gold / HUI

Gold is still in a trading range and within the wedge pattern which is coming closer to a point.

Gold is down today and as of this writing, it is off -$47.50 at $1665 which is near the bottom of the lower trend line. It's below the short, mid and 100 day moving averages.  Technically, it's in a bearish downtrend with lower highs and lower lows since the $1900+ peak that was reached in September.

I listened to one trader that mentioned December 15th would start an uptrend into the 2012 year based on 'Longwave' cycles and fibonacci retracements.  I'm not sure how some of these guys can predict the exact day an uptrend with occur with those 'tools', but if I could predict what tomorrow would bring, I'd be a billionaire.

The HUI Gold Bugs Index continues within a trading range and looks like it will remain within the blue box for the remainder of 2011. (Only 2 trading weeks left).


The fibonacci projection is up to the ~735 area from the current price of ~537 which would be a nice move for all solid Gold and Silver producers. Baring any major stock market declines/crashes that would take these stocks along for the ride, a breakout to the upside may occur within the 1st half of 2012.

Saturday, December 10, 2011

Silver = Trading range

Silver has been in a trading range since the last drop and announcement of the 'twist' program from the Federal Reserve.  It's currently trading under the short, mid and long term moving averages which is technically bearish.


You can see the 3 trading ranges indicated with the boxes since the Comex margin increases last May.  Fundamentally, Silver should break towards the upside with the debt issues in both Europe and the US.  But as well all know, the spot price is derived from the futures market and the individuals with the most money sets the prices in the short / mid term.

Bottom line is that it is very hard to determine which way it will break after this consolidation period.  Investors may have to wait until January to find out.

Tuesday, December 6, 2011

Jim Rodgers on CNBC

Jim visiting the NYSE and talks to Maria about the markets, debt, commodities, Europe and the US>

Monday, December 5, 2011

Waiting for Gold and Silver stocks to move up

is like watching paint dry over the last year plus.  Here is a weekly chart of the Amex HUI Gold bugs index which is in a consolidating range. (Blue box)

Major upper and lower trend lines are seen with the index in a long term uptrend. A fibonacci retracement is drawn from the 2003 rally.

The HUI has been in a consolidating range just over the fibonacci 261.8 level and will be approaching the lower trend line early next year.  If Gold moves to the upside in the first quarter of the year, Gold stocks may follow and send the HUI to the next fibonacci level of 423.6 or ~735.  (Currently at 561)

A move to the ~735 area on the HUI should move most Gold and Silver producers to the upside and to the next fib level on their respective charts.  All bets are off should the European debt crises crash the worldwide financial markets...  (Fundamentally, both Gold and Silver should go up with the current debt issues and the mining stocks should follow.  But with high frequency trading, hedge funds, leverage, manipulation, etc... you never know whats going to happen).

Saturday, December 3, 2011

Gold SIlver Ratio - Trading range

The Gold Silver Ratio has been in a trading range and will most likely continue until one of the metals makes a move either up or down with the other flat or moving in the opposite direction.

Here is a two year chart of the ratio with a 20 and 50 day moving average. I've placed Blue lines indicating the top, bottom and right in the middle for an estimated 50% level. 

One can make the argument that it is on an ascent and the ratio may be heading higher.  It's definetly on an upwards path of higher (from May 2011) , consolidation (Green boxes), higher, consolidation, ???   It's above the 50dma and also above the 50% retracement of the last significant move.

If Gold should move to the upside, it will pull Silver along with it.  If they appreciate at the same rate, we'll have a flat ratio.  It's a matter of time before Silver starts another rally to the upside and appreciate at a faster rate than Gold, maybe next year, maybe 2013?  Until then, expect Silver to lag / follow Gold's path whichever it may be.

Many expect the ratio to be under 20/1 at the final parabolic phase of the bull market.  That is why many people invest in this particular precious metal.  The downside is that it is much more volitile than Gold   With Gold currently trading at $1747 and ounce, a 20/1 ratio would put Silver at $87.35 an ounce. (Corrected Dec 21st from 78.40, error noticed by a reader) 

One can argue that you will be more than doubling your capital within the coming years by investing in Silver when it reaches a 20/1 ratio.  Not a bad return considering that a saving account is less than 1%.

Thursday, December 1, 2011

MF Global Fiasco

Listen to Jim Puplava interview Anna Barnhardt about the MF Global bankruptcy and John Corzine.

How is this guy NOT IN JAIL ? ? ?  (We know why, but STILL...  If you or I walked into a store and stole $500, we would be put in handcuffs and thrown in jail.  This guy stole over 1 BILLION and is out walking the streets...

Click here for the interview

Wednesday, November 30, 2011

Gold Nov 30th + Peter Shiff

Gold received a nice $34.10 boost today for 1.98% after new of the central banks and the federal reserve mentioned that they will boost liquidity to the banks if needed.  Hmm, an increase in digital dollars again?

The financial markets liked it with huge gains to the upside.  Money that was sitting on the sidelines was put to use today with European debt uncertainty in the background for now.  But it is a temporary 'fix' as the debt issue will inevitably rise again, it's just a matter of time.

Chart of the World Gold Index from mid June 2011 with a fibonacci retracement from the low of the summer to the high in late August / September.  Today's rally sent Gold up to the 61.8 retracement level and closing just above the 20 day moving average.

Should the US Dollar continue to decline in the short term, Gold may be able to break above the upper trend line and make an attempt at a new high or a triple top.

The Gold and Silver miners had a good day as well, following the appreciation with the metals.  Money may start migrating into this sector as more solid earnings are released.  Watch the HUI index for a potential breakout in December.

Here is a message from Peter Shiff regarding an entry point into Gold:

Silver was up .85 today for 2.64%.  Return year to date is 6.03%.     Gold's return year to date is 22.64%.  

Monday, November 28, 2011

Gold, US Dollar, SF Hard Assets Conference

Gold was up $25.80 today after the Thanksgiving holiday week.  It has formed a wedge pattern which typically ends with a move up or a move down breaking one of the trend lines.  Based on the US Dollar declining this week (more on that below), Gold should be on the move up at least for the short term.


If Gold should break to the upside, it should not be long before it tries to break through to a new all time high. It's now above the 50dma and the stochastics may now start an upwards trend from an overbought state.

The US Dollar Index looks like it is continuing to produce lower highs (see the post the other week regarding this).  Here is a 2 year chart of the US Dollar Index and it did get close to taking out the last rally high of 80.43, but it could only get up to 79.88 which continues the lower high trend.  It may be on a short term decline with should rally the US financial markets and Gold / Silver.


I was at the SF Hard Assets conference on Sunday and listened to Rick Rule.  He mentioned that there will an increase in volatility within the markets and the people that are prepared to trade it will be rewarded. (Buy low, sell high............he did mention that it is easier said than done).  He mentioned all of the things we already know like European debt, US Debt and if the 30 year mortgage rises from 4% to 6.5%, housing may drop another 25%.

He likes Gold and Silver as a store of wealth and select miners.

Thursday, November 24, 2011

Sprott to purchase 1.5 billion worth of Silver for PSLV

From Commodityonline:

Canadian billionaire Eric Sprott has filed for the purchase of $1.5billion in Silver bullion for covering an expected demand in his Sprott Asset Management's silver ETF- PSLV. A $1.5 billion in purchase will require about 45 million oz of silver.
Such a large purchase has normally Lead to higher prices. Sprott's $580 million silver purchase in 2010 was accompanied by an almost 175% gain in COMEX Silver when prices surged from $18 to $49! The current purchase of $1.5 billion is almost 3 times the 2010 purchase and as such prices could easily double or even triple.

Barclay's iShares Silver Trust issue also witnessed rapid price acceleration. COMEX silver had doubled from $7.50 to $15 within 6 months till the launch of the ETF.

Based on the info above, Silver _may_ start moving to the upside in the coming weeks as more physical Silver is removed from the market.  I say _may_ because the CME, CFTC and the bullion banks may have other plans for the remainder of the year...   Mr. Sprott can be seen as the Hunt Brothers of the 2010/2011 and going forward.

Wednesday, November 23, 2011

UDS Index Nov

Here is a 2 year daily chart of the US Dollar Index which has a long term downward trend, but short term upside momentum.


Even though it is moving up (and Gold/Silver going down), it should only be temporary as investors are parking their money into the US Dollar due to volatility in the financial markets.  The Index is still producing lower highs over the last two years:
$88.71
$83.52
$81.44
$81.31
$80.43 (Last peak)
Current rally ?

The last peak of 80.43 was very close to taking out the last high peak of 81.31 in January of this year which would have broken the downward trend of lower highs. Keep an eye on the current upside rally, if the downward trend continues, the current rally (78.44 and rising) should not take out $80.43. 

When the European debt issue is in the news, investors will flock to the dollar.  If it does not make headlines, the dollar will drop again...  risk on, risk off...

Monday, November 21, 2011

Saturday, November 19, 2011

Miner snapshot - Richmont Mines

Daily chart of Richmont Mines (RIC) from Sept 2010 to Nov 2011.

Richmont broke out to the upside in Feb 2011 and even though it has been through a rather bumpy ride since then, the medium term trend is up. The trading range between the upper and lower trend lines remains intact.....for now.

Some fundamental information from their website:

Quick Facts

  • The stock is traded on the TSX and NYSE Amex under the ticker symbol "RIC".
  • Fiscal year-end: December 31
  • Head-office: Rouyn-Noranda, Quebec, Canada
  • Shares Outstanding as of December 31, 2010: 31.2 million
  • Number of employees as of December 31, 2010: 407
  • Operating mines: 2
  • Mine currently being developed: 1
  • Number of wholly-owned mills: 2
  • 2010 sales: 68,123 ounces of gold
  • 2009 sales: 59,733 ounces of gold
  • 2008 sales: 70,945 ounces of gold
  • 2007 sales: 46,193 ounces of gold 
Richmont Mines has been successfully producing gold for over 20 years.

Our vision is to become an intermediate North American gold producer through a combination of organic growth, strategic acquisitions and partnerships.

We are…

  • A profitable gold producer, operating in a safe political environment;
  • Well-positioned to initiate partnerships and/or acquisitions.

We have...

  • Operational expertise in underground, narrow vein gold mines;
  • A portfolio of exploration properties in Quebec, Ontario and Newfoundland;
  • A strong, flexible management team;
  • A healthy balance sheet and underlying asset value.

We DO NOT have...

  • Any long-term debt;
  • Any hedging contracts. 

Our Mission: Building the Next Generation of Gold

Over 2010-2012, our focus will be on making the following key objectives and priorities a reality:
  • To operate 4 to 5 mines;
  • To increase our annual production to 200,000 ounces of gold;
  • To build reserves of 1,000,000 ounces of gold;
  • To reduce operating costs;
  • To initiate strategic partnerships and/or acquisitions;
  • To sustain a comprehensive Investor Relations marketing campaign;
  • To achieve valuation parity with our peer group of Canadian junior gold producers.
    Richmont Mines has one mine in development and 10 exploration properties. This company may be one to keep an eye on going forward.  Their website:  Richmont Mines


    Disclosure: At the time of this writing, GSR does not hold any positions in the company.

    Thursday, November 17, 2011

    Gold - Trading range / consolidation

    Not much going on with Gold lately. It is in a consolidation period after the run up in August.

    Here is a daily chart of the World Gold Index over the past 2 years.  White boxes indicate the consolidation periods after a run-up.


    It's a stepping stone pattern that has been repeated over the past 10 years. Everyone that has been dollar cost averaging into Gold has done quite well.  Both physical and the ETF's. (Investors of the precious metals ETF's should know that they will need to exit the trade should there be a divergence with the ETF and the physical price)

    You can see that the current box has the tallest range over the past 2 years.  Gold dropped $52.30 today for 2.95%.  Get used to these numbers as volatility is here to stay and will most likely increase. I heard one interview where investor Bert Dohman mentioned that Gold will go up more than $100 a day in the future. The way things are going, I think that statement is pretty much a fact.

    Monday, November 14, 2011

    Amex Gold Bugs Index - HUI

    The Amex Gold Bugs Index (HUI) has been in a trading range for just over a year and will eventually break out to the upside. Why to the upside? Barring any stock market crash or downturn that takes everything down, the Gold and Silver miners are producing excellent earning as they have been selling Gold over $1500 an ounce and Silver over $35 an ounce.

    Here is a weekly chart of the HUI index going back to 2002 with the current consolidation period indicated with the rectangle blue box.


    The HUI is in an uptrend and is trading between the upper and lower major trend lines with the exception of the 2008 financial market crash.  It is trading near the lower trend line, but a breakout above the 600 area should send shares of solid Gold and Silver miners upwards.

    Here is a daily chart of the HUI with the consolidation period indicated with the blue rectangle box.

    I've heard that many mutual funds and institutional investors do not know how to evaluate mining shares, so they just stay away from them and invest in a 'regular' company that they understand.

    Some may say that the miners have lagged because certain people believe that Gold is in a bubble and it will crash down any day. If that should happen, the miners will have a huge sell off...

    With enormous debt in just about every major country, Central banks and the Federal Reserve only know how to deal with the problem with one solution. Increase the money supply or 'print' more fiat. It's really just digital money and $100 bills are not being printed. Image looking at your bank account online and you see $11,543.10.  You can easily put a 0 at the end of it and you'll have $115,430.10, it's that easy for the Federal Reserve.

    Back to the HUI, if your holding Gold or Silver stocks, look for them to get a bid within the next 6 months (before May 2012).

    Saturday, November 12, 2011

    Fortuna Silver Mines (FSM)

    Fortuna Silver Mines is a junior Silver and Gold producer that is moving up towards Mid tier status. Their flagship mine is in Peru and have just went into commercial production on their San Jose mine in Mexico. See their website for details.


    Here is a weekly chart of FSM with consolidation periods marked with the blue boxes.


    If the spot price of Silver continues to appreciate from here, most solid junior and mid tier Silver miners should follow the uptrend. This may send miners like FSM to new yearly highs. The RSI on the daily and weekly charts are on the rise and may attain the 70+ overbought zone in a few weeks (?)  The stock has been in a trading range for the 2011 year and may be poised to breakout with the San Jose mine in production.

    Excerpt from their 3rd quarter earnings report: 
    VANCOUVER, Nov. 10, 2011 Fortuna Silver Mines Inc. is pleased to announce that it has filed its financial statements and MD&A for the three months ended September 30, 2011. The documents are available on SEDAR and have also been posted on the Company's website at www.fortunasilver.com 

    Third quarter 2011 financial highlights:
    Record net income of US$10.31 million, compared to a loss of US$0.77 million in Q3 2010
    Revenue of US$32.08 million, compared to US$17.88 million in Q3 2010
    Cash flow from operations before changes in non-cash working capital of US$18.21 million, compared to US$7.73 million in Q3 2010
    Operating income of US$14.89 million, compared to US$1.03 million in Q3 2010
    Cash position (including short term investments) and working capital as at September 30, 2011 were US$62.73 million and US$70.22 million respectively
    Silver production of 660,749 ounces up from 474,489 ounces in 2010; silver accounted for 70% of revenue
    Cash cost per silver ounce, net of by product credits, of US$1.45


    See that last sentence in red above, they are getting Silver for US $1.45 and ounce!  (I'd like to trade some of my US fiat in at that price!)

    This stock can be invested in for all three time frames, short, mid and long term depending upon one's investment philosophy. If you believe that the price of Silver will continue to appreciate going forward, this is one company to look into.  We cannot give buy or sell recommendations because we are not certified financial planners (CFP).  See full disclosure at the bottom of this page.
    Position disclosure: At the time of this post (Nov 12th, 2011), long shares of FSM.

    Wednesday, November 9, 2011

    Silver - Sideways

    Gold is on an uptrend, but Silver is going sideways.  The speculators in the Silver market over the past year should be skeptical because of the sell-off / manipulation in May and September.  Why should someone invest in Silver when it is tied to industrial demand and the worldwide economy is barely holding on. Add the bullion bank manipulation to cover short positions and you do not know what is going to happen day to day.

    OK, so with all of the negatives out of the way, Silver is still being scooped up by investors worldwide. The physical market is shrinking as more people wake up to what governments and central banks are doing.  It's going to be one rollercoaster of a ride for the next few years in Silver so hold onto the reins.

    Daily chart of Silver from late July 2011 (Thinkorswim platform).  A fib is drawn from the low in late 2010 to the peak in April 2011. Silver is at the 38.2% fib retracement / resistance level.  Add the 50 day moving average and we have sideways action. If (when) it rises above ~35.29, the next potential target level is $38.11 or a 50% retracement of the massive run-up last fall/spring.

    Tuesday, November 8, 2011

    Pivot points + Fibonacci retracement

    If you look at most stocks or commodity's, you'll see that they trade to pivot points within the day. (Google pivot points or look them up on your favorite stock charting website).  I noticed that today's Silver trading was between pivot points which is slightly unusual.  But when you place a fibonacci retracement on the chart at specific high and low points, you'll see that the price stopped at the 38.2 fibonacci level which provided some resistance.

    Here is a daily chart of Silver with a Fibonacci drawn from the low point early in 2011 to the high point in late April of $49.82.

     You can see the fibonacci levels on the left side at 23.6, 38.2, 50*, 61.8, 78.6 and the price levels on the right.


     Here is a 5 minute day chart with pivot points, the yellow is the center, then you have 3 levels of resistance points in red and 3 levels of support lines in green. The price action of Silver is trading in between the center pivot point and the upper resistance pivot point R1.  (Price action will typically move up to a pivot point)  If you did not have a fibonacci drawn, you would not see the 38.2 level based on the high a low points.  This level provided resistance to the upside as seen on the chart.

    Lesson:  If your swing trading, use pivot points with fibonacci retracement which may help you find hidden support and resistance levels.

    Monday, November 7, 2011

    Gold on a rally

     3 month daily chart of the World Gold Index.
     Gold has been on a rally since late October and is riding along the upper Bollinger band.  It is trading above all of the moving averages, 20, 50, 100 and 200 but the 20 day is still under the 50.  The 20 is trending up and may crossover the 50 by next week.... ?    The 20 day crossed over the 100 day 5 trading days ago.

    The Stocastics are going to 'embed' with both the K and D lines over the 80 level for 3 consecutive days. Technically, Gold should continue to rally this week. 

    Gold is up 26% year to date.  If it continues to rally for the month of November, look for profit taking in December by hedge funds, banks, Goldman Sachs, JPM, etc...  They will want to lock in their profits for the 2011 year to show their high end clients.  For the traders out there, keep your eye on the charts.

    Long term Gold holders have nothing to worry about, just sit tight for a few more years....

    Saturday, November 5, 2011

    Silvers Parabolic Years

    Since the bull market started in precious metals, the Silver market has had 4 'parabolic' years in which the price appreciated sharply followed by sharp declines. 2004, 2006, 2008 and 2011.  The pattern for 2004 and 2006 are very similar and 2011 looks like it is following this pattern.


    Wednesday, November 2, 2011

    US Dollar Index still heading down

    The US Dollar Index rallied last month which produced a high of ~80.43 which is just lower than the 81.31 on 1/10/11.
    The US Dollar Index has produced lower highs since 6/7/10 which retains the downtrend as defined by Dow Theory of lower highs and lower lows.  A break below 72.70 should send solid bids for both Gold and Silver. Although this may not happen within the next few months, it may be inevitable with the debt problem that the US has.

    I know many people continue to accumulate both Gold and Silver which is one of the best way to retain your capital at this time. I heard David Morgan mention that he expects a top in the PM markets around 2015-2016.  That gives the long term holder another 4-5 years to accumulate before the massive parabolic move when the public buys at just about any price.  When they can't purchase physical Gold or Silver, they may speculate and purchase the Gold and Silver miners pushing them much higher. In a parabolic market, it's best to sell portions of your position as no one can pick the top.  Selling in an 'up' market also guarantees a buyer on the other side.

    For those that trade Silver ETF's and miners should watch the end of this month closely. 2 of the last 3 parabolic moves in Silver ended the year on a downtrend.  See the post a few weeks ago with the Kitco 1 year charts of 2004, 2006, 2008 and 2011.

    Monday, October 31, 2011

    EU (European Union) Gold Silver

    Short Ytube vid from Mike Maloney's 'Whygoldsilver' channel talking about the EU kicking the can down the road and how the public is not informed about the precious metals markets.


    Saturday, October 29, 2011

    Silver miner performance year to date

    Below is a year to date daily chart of select Silver miners vs SLV which will represent Silver.  Overall returns can be viewed as the 'strength' of the company as viewed by investors.

    It is interesting that not all Silver miners follow the price of Silver as seen above.  Year to date returns as of Oct 28 for SLV and select Silver miners are:

    iShares Silver ETF SLV:   20.57%
    Fisrt Majestic AG:  36.25%
    Endeavour EXK:  26.58%
    Global X Silver Miners SIL:  2.5%
    Silver Standard SSRI:  -17.76%
    Pan American PAAS:  -20.03%

    The mid tier Silver miners First Majestic and Endeavour are positive for the year and have out performed the physical Silver year to date while the major Silver miners SSRI and PAAS have under performed. 

    I've heard David Morgan state that he was rebalancing his portfolio at the start of this year and it may be something that PM investors may want to do each quarter or on a yearly basis.  He mentioned that he was focusing on mid tier comapanies for 2011 which has been good advice as seen with the companies listed above.

    If you were to liquidate your portfolio of PM companies and reinvest the proceeds back into the PM industry, your allocation and the companies that you selected would probably be different than what you have now.  I plan on selling portions of certain miners before the end of 2011 and rebalancing for the 2012 year. 

    Thursday, October 27, 2011

    PM Breakout, Q4 rally...?

    Silver and Gold are both on the move today with speculators accumulating positions. Bullion banks may be taking long positions?  With momentum in the PM markets, hedge funds will push them higher looking for quick profits.

    A daily chart of the World Silver Index with a fibonacci retracement from the low in Aug 2010 to the 49 peak in April 2011.  Silver closed above the upper bollinger band and is heading up to the 61.8 fib level. It may have a pullback for a day or two but the next resistence point looks like the $37.50 area.

    The mining stocks are rallying with the PM prices but many are still lagging based on year to date returns.  Expect a solid rally into the 4th quarter based on good earnings reports.

    Tuesday, October 25, 2011

    Speculators back in ?

    Both Gold and Silver had a nice little bump up today.  (Potential breakout to the upside)  Looks like some of the speculators may be taking positions in anticipation for some price appreciation in November...? ? ?  Once the chart pattern reveals higher highs and higher lows, hedge funds will most likely be in on the ride up. Most of those on Wall Street can 'smell' money...

    Ever wonder why the price of a stock or commodity runs up, consolidates, then runs up again and consolidates at certain prices?  Take a look at Pivot Points, you can Google them for how they are calculated and used.  Today's action with both Gold and Silver hit the top Pivot Point which provided resistance on the upside.

    Gold futures 5 minute chart


    Silver futures 5 minute chart

    Sunday, October 23, 2011

    The Great Silver Debate (Kitco)

    Interesting debate on Silver price manipulation between GATA's Bill Murphy and CMP Jeffery Christian.

    Thursday, October 20, 2011

    Gold Trading range

    Daily chart of the World Gold Index from February 2011.

    A fibonacci retracement is drawn from the lows in Jan to the double peak in Aug / Sept.  Gold is in a trading range between the 61.8% and 50% fibonacci levels.   Gold is up ~13.7% year to date and can also be seen as consolidating after the huge run up between July and early Sept.
    The turn of the month may bring a movement either up or down. (Being a PM bull, I'm leaning towards the upside).  Being bullish at this time is opposite to the chart formation as Gold is trading under the 20, 50 and 100 day moving averages.

    Next week:  Oct. 27   Comex October gold futures last trading day

    Sunday, October 16, 2011

    Gold Silver Ratio - Entry points for Silver

    Over the last 2 years, the Gold/Silver ratio has had a RSI reading over 70 two times indicated below circled in red. (With the 2nd time was a few weeks ago). The 'overbought' reading can be used as an entry point into the Silver market.


    The late January 2010 RSI peak had a Gold/Silver ratio just above 70 which eventually dropped all the way down to the low 30's within 1 year and 3 months.  (A LOT of money was made by hedge funds and trend traders during this period).

    The current ratio is at ~52 and many precious metals investors believe that the ratio will eventually end up close to 15/1. (The ratio that our founding fathers wrote in the coinage act of 1792)
    Coinage_Act_of_1792

    With Gold currently at $1680, a 15/1 ratio would place Silver at $112.  One can purchase Silver at $32 an ounce today.  Do you like to purchase items when they are on sale?  How about money that you can get for a ~71% discount?

    Sunday, October 9, 2011

    Last quarter - Silver up or down?

    Silver has had 4 major sell offs/crashes over the last 10 years which were in 2004, 2006, 2008 and this year, 2011.  For the 04, 06 and 08 sell offs, 2 years of the 3 had rallies into the 4th quarter. (04 and 06 which dipped in December).


    A yearly chart of 2004 from Kitco:

    A yearly chart of 2006 from Kitco:

    A yearly chart of 2008 from Kitco:  (Financial Crises Crash year)

    A yearly chart of 2011 from Kitco:  (Up to October 7th, 2011)

    Will the Silver spot price follow the rally of 2004 and 2006?  Or will it follow the 2008 chart and dip yet again for a small rally in December?   Mark Twain has mentioned 'History doesn't always repeat itself, but often rhymes".    

    With the debt issues in Europe, both Gold and Silver _should_ go up.  But when investors are loosing $$$ on other stocks, commodities, currencies, etc,,, they will sell their Gold and Silver to cover the losses.  This can lead to a temporary sell off with the metals, even if they should fundamentally go up.

    With that said, I'm leaning towards the rally side for the 4th quarter, but it is really anyone's guess. Especially when you have bullion banks with hundreds of millions of dollars to move the futures markets. When they need to cover a short position, they can drop the market 25% + in a matter of a few days.

    Gold is up 14.75% YTD
    Silver is up 5.74% YTD

    Sunday, October 2, 2011

    Technical analysis in a manipulated market

    Can you use it and does it work?  Yes, but it depends on your time-frame, risk tolerance and objective.  Here is a year to date daily chart of the World Silver Index.  A fibonacci retracement is drawn from the August 2010 low to the high of late April 2011.

    The Silver market is a good place for traders as it has volitility and some safety as the metal will never go to zero.  For traders to make money, they need movement either up or down, so they can either go long or short on their trades, either daily or a swing trade. They just follow the momentum and make money on the short term trends.

    For the mid and longer term holders that are not using stops or are holding physical, technical analysis may not be a good tool to use as market manipulators can bring down the market within a few days as seen in May and Sept of this year. Because Silver as seen as both monetary and industrial metal, some may say that the outlook for the economy is weak so there is less industrial demand, justification for the sell-offs.

    For long term physical holders of the bullion, you really do not need to look at the price and charts of the metals on a daily basis.  Once a week on a Sunday should be fine as this bull market looks like it will continue for years to come. (Unlike the 1970's PM bull market which lasted for 10 years). If divided into 3 phases, we are still in the 2nd phase.  Between 2013 and 2015 should be exciting times for both Gold and Silver.

    I am holding physical metals for the long term and do not care about the price swings up or down. I have another account that I purchase PM ETF's and Gold/Silver miners that I trade.  When you know that this market is heavily manipulated, It's best to take the money are run when you are profitable.  I have a few miners that I have held for more than 1 year and are in the long term capital gains category, but I mostly swing trade as you never know when the cartel will bring down the markets.

    As far as the current Silver market, it dropped from the $40 level down to $26.15 in 3 trading sessions.  It has since found support around the 38.2 fibonacci level which is around $30. Many technicians believe that there is support at the moving averages which would have been the 100 day in pink or the 200 day in orange, but you can throw all of that out the window when the manipulators want to bring down the market.

    My projection now is for Silver to base and rise back to the $40+ level by the end of the year.  Can the cartel bring down the price even further? Anything is possible, especially when you need to cover large short positions.

    Wednesday, September 28, 2011

    Why we choose to be in a manipulated market?

    Everyone that trades in their hard earned fiat currency for both Gold and Silver do so because of the fundamentals reasons, debasing currency. While it may not be legal for us to counterfeit US dollars, the Federal Reserve can do it, hand the fiat to the banks and it is perfectly legal.  The banks that created the whole financial mess gets rewarded with bail out money, good job. (And the tax payers flip the bill with inflation)

    So your holding Gold and Silver bullion and are in it for the long term as you know that the money supply is increasing on a daily basis.  Do not loose sleep over the price declines, over time both Gold and Silver will make new highs, it may take 6 months, maybe a year but they will go higher because the Federal Reserve and the Central Banks will continue to debase the currency.

    For the short term and mid term PM prices, they can do just about anything, especially when you have a banking cartel, the CME, LBMA colluding together to suppress the price at the same time. It helps those that are 'stuck' in short positions that are underwater and those on the inside can front-run the markets with short positions on the futures exchange, puts on GLD and SLV and purchase ZSL, GLL, DUST.  It's easy money when you can hike margin requirements and are 100% confident that the commodity price will decline. Many banksters and insiders should be in jail for doing this, but there is 'Too big to fail' and Too big for Jail'. When you own congress, you get away with a lot of things.

    What to do?  If your long bullion, don't worry and go to bed happy that you purchased more at a lower price.  I'm happy to trade in my fiat for Gold and Silver.  I need to find more paper to trade in.....what a joke.

    I am long bullion that I am not going to touch until the Dow/Gold ratio is 2/1. Combine that with a Gold/Silver ratio under 20/1.  That is when I will start selling portions of my bullion.

    If you trade short term / swing trade.  Take the money and run when you can.  When the RSI is above 80, set your stop up close. I was listening to a radio show where a guy mentioned 'Sell first and ask questions later'.  We should do the same.


    Tuesday, September 27, 2011

    Short covering rally

    As expected, the shorts are covering after the sell-off last week. (The too big to fail bullion banks make loads of fiat/'money' on the upside and downside). If you can't beat them, join them huh?  We just need to know when the banks collude to sell off their futures contracts and when the 'crimex' increases margin requirements.  Not a easy job when your an outsider.

    Below are 5 minute charts of Gold and Silver, both may have bottomed on Sunday evening futures trading and are in short covering mode (rally). Based on the charts, you just never know if this low will hold when the banks can bring the 'price' down on a whim.

    Gold hits a low of $1535

    Silver hits a low of $26.15

    Nothing has changed fundamentally regarding both Gold and Silver. The monetary supply has expanded more since 2008 than ever before. If the U.S. Market starts to break further to the downside, the Fed may step in and offer up another 'QE' program in an attempt to 'stimulate' the economy again.  Albert Einstein quote:  'Insanity is doing the same thing over and over and expecting different results'.

    Europe debt is completely out of control and the politicians/banksters essentially do not know what to do about it aside from fixing the issue with a bailout. Counterfeiting currency is illegal for citizens to do, but it is completely legal for governments around the world.

    Trading your fiat for Gold and Silver is not a get rich quick scheme. The declines attributed to the bullion banks are an attempt to show people that PM's are not a good place to 'invest' and can loose 'money'.  These crooks can manipulate the spot price, but the free markets will eventually take over.  I will personally continue to accumulate as much PM's as possible when the prices declines as seen last week.