Thursday, July 28, 2011

5 year returns for GLD, SLV, Gold/Silver miners, Junior miners, Silver miners

A 5 year chart for GLD (Gold), SLV (Silver), GDX (Gold/Silver miners ETF), GDXJ (Junior miners ETF) and SIL (Silver miners ETF)

Returns:
SLV -    240%
GLD -   149%
SIL -     73% (Started in spring of 2010, about 1.5 year history)
GDX -  49%
GDXJ - 43%

Silver started outperforming Gold from August 2010. If the rally never occurred, Gold would have been the leader at 149%.  Going forward, the Gold/Silver index should be dropping in the next few years.  Many long term Silver holders may start selling some of their positions when the Gold/Silver ratio is under 20. Some have stated that the Gold/Silver ratio may go down to the 10 area or slightly below.

If Gold hits $5000 an ounce, a 15/1 Gold/Silver ratio will put Silver at $333

Tuesday, July 26, 2011

Short covering in Silver

The shorts have made some pretty good $ from $49.xx to $32 and have probably traded the peaks near $38 during the consolidation over the past 2 months.  Anyone that place on a new short at $38, $39, $40 are now in the red.  Will they wait for a dip to buy back or cover while they can?


The bears see a financial instrument hitting a 2 month high and some may believe that the price will get knocked down, so they will put on a short position. 

But the bulls see the chart as producing higher highs and higher lows which is an uptrend.  There are also moving average crossovers of the 15dma over the 50dma and the 100dma which is a bullish sign.  The price is also trading higher than the May 11th high of $38.47 which is depicted by the white horizontal line.

There are also many fundamental reasons why Silver should go higher in price.  Gold took out the 1980 high of ~850 in 2008, 3 years ago.  Silver is still trading under the 1980 price.  Most governments are debasing their currency as that is what they do to take care of the debt problems that they have. It's kick the can down the road and the next officer will address the issue.


Stay long physical Silver until the Gold Silver ratio is under 20.  Swing trade the ETF's and miners and most people should do well with just investing in the PM sector over the next 2-5 years.

Sunday, July 24, 2011

Silver miners

I recently listened to a radio show that featured David Morgan, the Silver guru.  He mentioned that he has positioned his subscribers into the mid-tier Silver producers as he thought that they had the best risk-reward going forward.  He also mentioned that his subscribers have done well investing in this particular area.

It does make sense as the senior Silver producers are 'fairly' valued by the markets and the upside compared to a company that is rapidly expanding with increased production.   Some of the small cap Silver companies may be acquired by either a mid or large cap company, but you just never know which one.

There are only a handful of true Silver miners (compared to Gold miners), so it is not hard to narrow down the mid tier companies. Here is a list of the top 20 Silver producers as per the Silver-Institute:


Here is the Global X Funds Silver miners ETF holdings:


You can check out the prospectus by going to the Global X Funds website at globalxfunds.com/

I am currently long a few of the companies listed in the above index and hold shares long the index itself, ticker: SIL

Silver is currently trading around the $40.42 area and the days in the $30'ies may be numbered.  Just like $1000 Gold....  With major debt issues in europe and the US on the verge of increasing the debt ceiling, both Gold and Silver (and select miners) should have a solid run-up toward the end of the year.


Thursday, July 21, 2011

Sideways before >$40

Daily chart of the world Silver index from early May, 2011.   Silver has the short term 15dma crossover the 50dma on July 18th which is a bullish sign.  Is there more to come?  The next crossover would be for the short term moving average to cross over the 100 dma which may be as early as next week.

There is a bit of resistance at the even number 40.  Once through, 40 should become support and some may wish that they purchased those Silver Eagles when the spot price was at $33.

With the slight drop in the price, Silver is now under the Bollinger band and may consolidate for a short while just under the $40 level before the next ascent to $42/$43 level.  Europe still has major debt issues and the US is going to increase the debt ceiling which gives them the opportunity to increase the money supply.


Wednesday, July 20, 2011

Hong Kong Mercantile Exchange to launch silver futures on July 22

From Reuters:

SINGAPORE, July 18 (Reuters) - The Hong Kong Mercantile Exchange (HKMEx) said on Monday it will start trading a dollar-denominated silver futures contract on July 22, hoping to tap into the growing demand for the metal in China.
The silver contract will trade in lots of 1,000 troy ounces and be delivered in Hong Kong, the exchange said in a statement.
Silver demand rose 67 percent in China and 17 percent globally between 2008 and 2010, the exchange said, citing market data it has compiled.
"The new contract will enable buyers and sellers in China to trade effectively with their counterparts across the world, while at the same time, allowing investors to gain exposure to silver price movements and broaden their investment portfolio," said HKMEx president Albert Helmig in the statement.
The exchange rolled out a dollar-denominated gold futures contract in May.
The exchange also plans to launch yuan-priced gold and silver futures to capitalise on growing investor demand for China's strengthening currency, with further ambition for products in base metals, energy and agriculture, Helmig told Reuters earlier this month.
Spot silver traded at $39.89 an ounce by 0707 GMT, down 19 percent from a record of $49.51 hit on April 28. The metal, notorious for price volatility, surged 60 percent earlier this year to the peak before dropping 33 percent over six sessions in early May.

Keep your eye on the Silver spot price on Friday morning trading in the US.  We will see if this has an impact on the worldwide spot prices going forward.

Tuesday, July 19, 2011

The Money masters

A movie that everyone that is interested in precious metals should watch.  It is 3 hours!  Check it out on  Youtube if you do not have time now.  It chronicles the bankers throughout history and how they continue to produce money, create recessions/depressions/fund wars, etc... 


Monday, July 18, 2011

Gold stocks rally participation

2 year daily chart of the Amex Gold Bug's Index - HUI shown in the dotted line and Gold in the solid black line.  With the sell off in early May with both Gold and Silver, the miners have also been sold off more than the metal as depicted on the chart.

The HUI has bottomed out in late June and has been on a significant rally which has followed the price action of Gold.  With the S&P volatile, traders seem to be finding value with the miners as their earnings should be very solid compared to the average company within the S&P500.

The HUI may crossover Gold sometime this year and may lead, so the total return for the year may be higher with the miners.  ETF's like the GDX (senior miners) and GDXJ (junior miners) are an easy way to invest in a mutual fund of miners.  Global X also has a exploration ETF named GLDX.

1 year Daily chart of GLD (Gold ETF) vs the GDX (Gold miners ETF).  Gold has outperformed with a return of 31.7% vs GDX of 22%.

Disclosure:  I do not have any investments in the above mentioned ETF's.

Sunday, July 17, 2011

Silver prepared for take off?

Daily chart of Silver since late June 11 on the Think or Swim platform. (Ameritrade).   There is a 'study' on the chart from TTM (Trade the Markets) which indicates a trend when the daily bars turns blue in color.  The lower indicators Squeeze/Wave are momentum and above the center line is bullish which they both are.

In early trading on Sunday evening, the price is just under $40 an ounce.  Silver is trading along the upper bollinger band for the last 3 trading sessions, 4 including today.  A minor pullback sometime next week will most likely be short.

With Gold near the $1600 level and ascending, Silver should tag along and the Gold/Silver ratio should continue trading in the 40 range.  With Silver still under the 1980 all time high of near $50 an ounce, it is still undervalued.  The Silver/Gold ratio is going under 20, so if one were to accumulate a precious metal, Silver has more upside than Gold.  The ratio may be somewhere in the low 30's at year end.


The miners are also starting to rise with the metals which is good news.  One is able to get the opportunity to purchase Gold at $600 an ounce when the metal is trading near $1600.

Friday, July 15, 2011

New all time high for Gold

3 month daily Gold chart July 15th.   A new high produced for Gold which is counter seasonal.  With Ben Bernake hinting of further stimulus if the economy should continue it's weakness and the European debt crises, the only 'safe' place to hold money is hard assets like Gold or Silver. 

The short term 15dma is heading up and has broken upwards over the 50dma. The 3 moving averages are in line for a continuation bull run to the upside.  The $1577 area will be support, then the even number of $1600. 

With this early bull move in the Gold market, it is poised to make a huge rally going into the 4th quarter of the year when the seasonal trends kick in and really move the Gold market.

Gold miners are also moving up nicely with the metal.  To reduce risk, the 'senior' miner ETF GDX and the Junior GDXJ should be solid plays going into the latter part of the year. (Barring any stock market crash).

The Silver miner ETF SIL is also moving up along with the metal.  As James Turk stated, if the Gold Silver ratio is above 20, Silver is a buy.

Tuesday, July 12, 2011

Gold/Silver summer trading range continues

Daily chat of the world Gold index from the low produced on 1/28/11 of $1307 to the high on 5/2/11 of $1577.
A fibonacci retracement is drawn from the low and high that is mentioned above.  Gold has been trading within the bands of 61.8% to just under the 100% high point since May 2nd.  Based on seasonal's, Gold may breakout to new highs in September, the highest average % gain of any month within the year.

Gold is seen more as a currency as it has had numerous up days with the US Dollar. With Greece and other countries in bad fiscal shape, the flight into both Gold and the US Dollar is seen. In the long run, the US Dollar will continue to deteriorate with the government increasing the debt ceiling so they can create more $$$.  Be patient and this market should see significant gains to 2015.

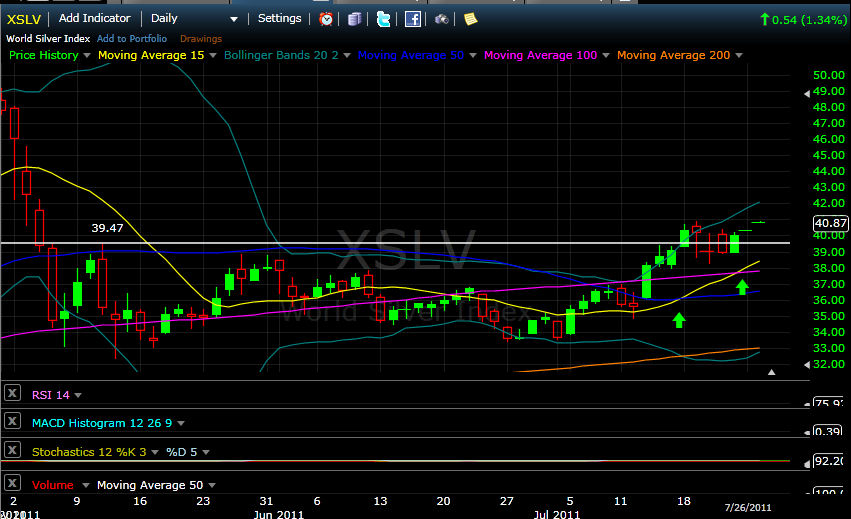
Daily chart of the World Silver index from early May.  Silver is also in a summer trading pattern between the fibonacci bands of 38.2 to  50. (Based on last years August low to the high produced in late April)

Silver has produced a series of lower highs since the short covering rally in the 2nd week of May. The bollinger band has narrowed in and there should be a breakout one way or another before September. (In general and based on Seasonal data, the breakout is likely to go to the upside, but when you have market manipulators, banksters/comex you just never know).  It's just best to be on the 'right' side of the trade and do not trade against the pro's/manipulators.

With the economy still in speculative shape at best, some traders are selling the industrial metals which include Platinum, Palladium, Copper and Silver. This can be a good issue for Silver as it will be seen as a monetary metal and have a Gold/Silver ratio below 20/1 at some time in the future. It's a waiting game.

Saturday, July 9, 2011

SGT interviews James Turk

A vid on the 'tube' from SGT who interviews James Turk.  James is a full bull when it comes to the precious metals  markets and is not shy from predicting price targets.


Part 2

Tuesday, July 5, 2011

PM Summer rally ?

Could today's rally in Gold and Silver the start of an early summer rally? Both Gold and Silver started their upwards trend last year in August after Ben's speech in Jackson Hole.

With fiscal problems in Europe and countries worldwide debasing their currencies, the potential is a possibility for an early start to the fall PM rally...

A 5 minute chart of Silver Futures.  Quick, someone call the COMEX and tell them that Silver is appreciating too fast (from $34 to $35.69) in ONE DAY.  The COMEX needs to increase margin requirements a few more times to bring Silver down to $23 an ounce so the banks can cover the remaining short positions.  (And the COMEX numbnuts can short and make more money)