Wednesday, September 29, 2010

Save those old Silver coins

www.coinflation.com    website
If you happen to collect old US Coins in the denominations of .10, .25, .50 and $1, check out the www.coinflation.com website as they list the value of the coin based on it's Silver content.

Coins produced in certain years have higher Silver content than others. You will typically find that the older coins have a higher Silver content like the 1878-1921 Morgan Silver dollar which is 90% pure Silver.  Compare that coin to the Kennedy Silver Half Dollar which is 40% Silver.

Some people are purchasing as much of these coins as they can to hedge against a possible hyperinflation environment in the coming years.  These people believe that they will one day be able to use these coins to purchase groceries at the market as the precious metal inside (Silver) will have purchasing power compared to the US Dollar. (Which is a piece of paper with green ink on it)

Tuesday, September 28, 2010

US Dollar Index

U.S. Dollar Index
Here is the US Dollar Index which is on a trend down which bodes well for the precious metals market, specifically Gold. (They typically trade opposite of each other) It closed at 79.33 which is the first time since March 2010. If the index should trade below the 70 level, Gold should continue to increase in value due to the dollars devaluation.

Although this is typically good for precious metals investors, it's not good as far as inflation. Prices for consumable items such as gasoline, food and daily personal hygiene items will continue to rise in price. I'm sure most people already realize this after a trip to your local grocer. Prices have gone up and product volume has gone down. It is something that you'll need to get used to should the dollar index continue to fall and Gold continuing to rise...

Gold to $1500 before the end of the year...?

Bloomberg news:

Monday, September 27, 2010

Gold Sept 27, 2010

World Gold Index, Sept 27, 2010. 7:50 PST
The chart is fairly self explanitory, a bull trend since late August 2010 with higher highs and higher lows. No significant pullbacks yet. There is some resistenace at the $1300 level, but I think that will be short lived. As long as the stochastics stay embedded (both K and D lines over the 80 level), Gold should be trading over the $1300 level within a few days/week. If the K line stochastic breaks below 80, we may see a short term pull back before closing above the $1300 level.
The goverment / Obama administration continues to print up money to get this economy in favorable shape going forward. The only way governments can assist is to print up more money to help failing businesses and bail out major corporations (like the auto industry). Another $42 billion is going to be 'borrowed' from small businesses to help put 500k people back to work and assist with the unemployment rate across the nation. It is something that is needed as people want to work. I'm not sure if these loans will get paid back, especially if the business that receives the loan continues to struggle.

$42 billion small business bill signing by President Obama on Monday With government money printing presses going, Gold should continue to rise in U.S. Dollars. As Gold goes up, you can also see it as your dollar losing value.

New high for Silver

World Silver Index XSLV on Sept 27, 2010. 6:55am PST

Not much to say about Silver and this particular chart.  Since August 24th, it has been on a bullish run with no significant pullbacks. Stochastics are embedded and it suggests higher prices going forward. It is trading over the high in 2008 of $21.35. 
As mentioned in previous posts, the fibonacci suggests that the next peak will be around the $26.25 area which may be next year...?  I would guess that there will be a few pullbacks and consolidation before reaching that level.
With the Dow, S&P500 and Nasdaq recovering from their recent pullback, the latest news is that the overall U.S. economy doesn't seem as bad as once thought. The chances of a double dip recession is less likely going forward based on economic data.  This bodes well for Silver as industrial use and demand will also pick up.

Friday, September 24, 2010

30 year high for Silver

World Silver Index
The World Silver Index closed at a 30 year high at $21.48 an ounce. Stochastics are embedded and we have a solid upwards trend. Higher Silver prices looks inevitable going forward.

Next major peak, $26.25 an ounce based on the fibonacci retracement.

Wednesday, September 22, 2010

A good explanation video on the devluation of the US Dollar

But first, another new closing high for Gold at ~$1291 and change.  $9 from the $1300 level.
This video explains the devaluation of the US Dollar
                                 
Disclose.tv - Gold VS Dollar-The Truth About Money Video

Tuesday, September 21, 2010

Gold -> Closes at new high Sept 21, 2010

World Gold Index at a new high of $1279.30
All of the technicals remain the same with one addition, the 50dma has crossed over the 100 dma. Another positive for the technical analysis crowd. The chart is in a typical bull patter with all of the moving averages in line from top to bottom: 15, 50 and 100.  A new closing high was hit today at $1279.30, only $20.70 away from the $1300 level. Once hit, the news and financial stations will be reporting as the latest breaking news!

Monday, September 20, 2010

WSJ News Hub: Brett Arends on Gold's Biggest Myths

Gold Silver Ratio

Gold Silver ratio as of Sept, 19th, 2010


The Gold Silver ratio hit a high near ~100 in the early 1990's.  Since then, we have had another peak around the 85 level few years later around 2009. The long term trend is down.

Here is a 2 year Gold Silver ratio chart with a trend line drawn from the highs in 2008 (~84) to the recent lows in July 2010.  Intermediate trend is down.

Here is a 6 month Gold Silver ratio chart with a support line drawn from the April 2010 lows of just under 63. The ratio breached the support in early Sept this year.

Here is a 60 day Gold Silver ratio chart at the ~61.4 area. The short term trend is down. The next area of support is the 59 area based on the 2 year chart. This level needs to be pierced for Silver to get to the next level and possibly onto substantial new highs.

If you believe that the Gold Silver ratio will return to 'The Coinage act of 1792' proclamation, Silver may be an investment that should be considered.  The Act defined the proportional value of gold and silver as 15 units of pure silver to 1 unit of pure gold. Standard gold was defined as 11 parts pure gold to one part alloy composed of silver and copper. Standard silver was defined as 1485 parts pure silver to 179 parts copper alloy.

With the current price of Gold at $1280 an ounce, a 15/1 Gold Silver ratio would bring Silver to the price of ~ $85.33 and ounce. Hmm, you should have a very nice return on all of those Silver Eagles that you purchased when they were selling for $10 each.


World Silver Index Sept 20, 2010

3 month chart of the World Silver Index, Sept 20, 2010, 7:33am PST.
All of the technical indicators from the previous posts remain the same, Silver is in a bullish trend with higher highs and higher lows. Embedded Stochastics indicate upwards momentum going forward.  Based on this index, Silver is .48 from meeting the 2008 high of $21.35.  It passed the May high of $19.85 with no major resistance.

Based on a fibonacci drawn from the 2008 lows to the 2009 Dec high, the next peak at the 161.8 level is $26.25. (Circled in white)

Silver should continue to appreciate in the next few months based on seasonals, uncertainty in the worldwide financial markets, industrial demand and possible short covering.

Saturday, September 18, 2010

Year to date return for Gold -> 17%

Above is the XGLD, World Gold Index since the start of this year to the close on 9/17/10.

Gold started the year around $1086 and the World Gold Index closed at $1275 on 9/17/10. This is a 17% return so far.  How much did your savings account return on your money? Did you have any other investments? Stocks? Bonds? CD's? T-Bills? Money Market?  How is the year to date return on those investments so far?

Commodity bull markets last for over a decade and this one should be intact for a few more years. (As heard from so called experts). If that is true, we still have 2-3+ years of some very good gains with Gold. Individuals that continue to keep their money in savings accounts have missed out on very good gains over the last 9 years.

As far as the chart and technicals, the price broke through the old all time high of 1266.50 and settled at 1275.90 for the close on 9/17/10.  The 50 dma is close to crossing over the 100 dma which will complete a bullish trend with the 15 dma over the 50 and the 50 over the 100 dma.   MACD histogram is heading back up and this suggests higher near term prices going forward.  $1300 Gold may be seen soon should the trend continue.

Wednesday, September 15, 2010

Rob McEwen on Fox Business -> Gold to $5000 an ounce

Rob McEwen CEO of US Gold interviewed on Fox Business:

Technical analysis World Silver Index

Here is a year to date chart of the World Silver Index for Sept 15th, 2010. It has been in a bullish trend since August 24th with higher highs and  higher lows.  Stochastics are currently embedded and the MACD Histogram is above the centerline and rising again.  Should the trend continue, the 2008 high of 21.35 may be pierced in the near future. Silver had a all time high price of +$50 and ounce in 1980, but it was manipulated by the Hunt Brothers. <-Click to read a short article on their story)

When Silver does hit $50 and ounce, this time it will not be by manipulation, but by:
  • Investor demand
  • Short squeeze
  • Industrial demand
Based on a fibonacci drawn from the low in 2008 to the high in May 2010, the 161.8 level suggests the next high of $26.25 an ounce.

Tuesday, September 14, 2010

Technical analysis World Gold Index


Here is a 3 month chart of the World Gold Index (XGLD) with a closing price of $1270.20 on Sept 14st, 2010.    (Click on the chart for a larger view)

GSR wanted to publish this particular chart because Gold closed at an all time high, $1270 an ounce! The previous high showed no significant sign of resistance.

There are many different views and predictions on the next level and year end closing price.  It's very hard to accurately predict where Gold, Silver or any particular commodity or stock is going. If someone knew with a good degree of accuracy, he/she would probably be retired and a billionaire.

If you place a fibonnaci retracement from the low in 2008 at $699 to the run up high in Dec at $1227, you get the fibonacci level of 161.8 near the $1560 area. This can be the next peak for Gold, then a ~15% pull back and trading range/channel. Keep your eyes on Gold as the seasonals and September looks like it is on par to become a stellar month based on past history.

Technical analysis Fortuna Silver Mines

 
Here is a 3 month chart of Fortuna Silver Mines on Sept 14st, 2010 at 8:25am PST.    (Click on the chart for a larger view)  Fortuna Silver Mines was a company listed in the article last week on Silver miners entering profitable phase.

  • Fortuna has made higher highs and higher lows since the Aug 4th low at $2.10. Bullish
  • The price is above the three moving averages of 15, 50 and 100. Bullish
  • The 15 dma crossed over the 55 dma on 8/4/10. (Indicated with a white arrow) Bullish
  • The 15 dma crossed over the 100 dma on  8/19/10.  (Indicated with a white arrow) Bullish
  • The 50 dma crossed over the 100 dma on 9/1/10. Bullish 
  • The MACD Histogram is above the center line and rising. Bullish
  • Stochastics K and D are above the 80 level. Overbought / Bullish
Fortuna has been trading fairly flat near the 2.15 area for most of the spring and summer. It rose to the $2 level last year in Nov and has gone as high as $3 and backed off in a small trading range between $2 and $2.20 area.  It basically consolidated over the summer and is now breaking out to the upside with the spot Silver price increasing. As of early trading today, it has taken out the old $3.01 high set on Jan 11, 10.  


Based on a Fibonacci retracement between the high and low, the 161.8 level is at $4.66. 


Fortuna released drill results last week from the Don Luis II vein, located in the undeveloped western portion of the Caylloma Mine. (Peru)  With growing Silver/Gold reserves, seasonals, possible short squeeze and increasing Silver spot price, the stock should continue to appreciate going forward. 

Disclaimer: I own shares of Fortuna Silver Mines in the 'long' position. 

Monday, September 13, 2010

Technical analysis SLV

Above is a ~4 month chart of the iShares Silver Trust ETF. Many view this ETF as a trading tool to swing trade Silver and it's price movement. The price trades just below the spot price of physical Silver.

Last week the May high (and resistance level) of $19.44 was pierced producing a new high for the year. (Hit a high of $19.63) Today in early trading, SLV hit a high of $19.72, if the bullish trend continues, we may see the price near or above the 2008 high of $20.73 (Green horizontal line) by the end of the year if not sooner.

  • SLV has higher highs and higher lows since 8/24/10 ($17.48).  Bullish
  • Trading above the moving averages of 15, 50 and 100.  Bullish
  • MACD is positive, above the center line. Bullish
  • Stochastics are 'embedded', both K and D lines are above the 80 level. Bullish
There are quite a bit of articles regarding the manipulation of Silver in the US Market. JP Morgan (Owner of the largest short positions in Silver) announce last week that they will be closing some of their proprietary-trading operations
Excerpt from the WSJ:
The bank hasn't focused much on proprietary trading, but its small proprietary-trading desks are nonetheless affected by the Dodd-Frank financial-overhaul law, particularly by what is known as the Volcker rule, which curtails proprietary trading, private equity and other investments that banks make with their own capital rather than for their clients.
J.P. Morgan has decided to exit from all proprietary trading, and its commodities proprietary-trading desk, which is in London, was one of the largest such trading desks at the bank, according to a person familiar with the matter. The status of the other proprietary-trading desks is unclear, but they, too, have been or will be closed, the person said.

The bank hasn't focused much on proprietary trading....? Hmm... How about the worlds largest short position in Silver? Were those trades specifically for their clients?

Description of iShares SLV
The sponsor of the Trust is BlackRock Asset Management International Inc. (the Sponsor). The trustee of the Trust is The Bank of New York Mellon (the Trustee) and the custodian is JP Morgan Chase Bank N.A., London branch (the Custodian). 

So what is the relationship between holding a very large amount of Silver in a vault in New York and the largest short position in Silver? (We do not know)

Back to the analysis: Even if SLV does produce a new high, the past 2 year history shows us that it has always pulled back into a trading range. Will this be the case this time around?

With the price of Silver increasing, there may be a short squeeze sending the price higher going forward. The bears looking at the past history of Silver may think that it will pull back again to the $17 level and the $20 area is a good place to short. If the squeeze continues, they will also be forced to buy-back sending the price higher.  So the theory goes...

Keep your eye on this one as we think it's going to be interesting going forward.


Sunday, September 12, 2010

Technical analysis XGLD


Here is the chart of the World Gold Index (XGLD) since mid July with a closing price of $1245 on Sept 10st, 2010.    (Click on the chart for a larger view)

  • Gold has made higher highs and higher lows since the July 28th low at 1155. Bullish
  • The price is above the three moving averages of 15, 50 and 100. Bullish
  • The 18 dma crossed over the 100 dma on 8/16/10. (Indicated with a white arrow) Bullish
  • The 18 dma crossed over the 50 dma on  8/23/10.  (Indicated with a white arrow) Bullish
  • The 15 day moving average is above the 50. The 50 day moving average is above the 100. Bullish 
  • The MACD Histogram is above the center line and descending. Neutral/Bearish
  • Stochastics K line crossed over the D line and is below the 80 level at 68. Bearish 
The price dropped below the 15 dma on Friday and moved up to close right on it for support.  If Gold continues to decline, there are a few areas of support, depending upon the indicator that is used.

1227.5 level as that was the previous high in Dec09.  
The last break low was at 1238.10 on Sept 3rd.
The 50 and 100 dma is at the 1212 level.
Bollinger band is at the 1216 level.

Gold has appreciated from the 1160 level in late July to the 1260 level in early Sept, about $100 in just over a month. We may experience some small correction which has been the 'norm' with the Gold price after a run up.  As mentioned before, every time Gold has pulled back since 2002, it has recovered and progressed to new highs.  I would expect the all time high of 1266.50 to be breached before the end of the year.

Thursday, September 9, 2010

Technical analysis XGLD

Here is the chart of the World Gold Index (XGLD) since mid June of this year with a closing price of $1249.40 on Sept 8st, 2010.    (Click on the chart for a larger view)

  • Gold has made higher highs and higher lows since the July 28th low at 1155. Bullish
  • The price is above the three moving averages of 15, 50 and 100. Bullish
  • The 18 dma crossed over the 100 dma on 8/16/10. (Indicated with a white arrow) Bullish
  • The 18 dma crossed over the 50 dma on  8/23/10.  (Indicated with a white arrow) Bullish
  • The 15 day moving average is above the 50. The 50 day moving average is above the 100. Bullish 
  • The MACD Histogram is above the center line and descending. Neutral
  • Both Stochastics K and D lines are above the 80 level and are 'embedded'.  Bullish
 Gold closed $6.10 lower, but is still in an uptrend pattern with higher highs and higher lows. If $1238.10 is breached, the uptrend will be nullified. The 50 day moving average is very close to the 100 day moving average and may dip below. (Indicated by a yellow arrow) In a typically bullish uptrend, the 50 dma is above the 100 dma. 

The low of the day touched the 15 dma which is the first level of support. Because the stochastics are embedded, breaks may present buying opportunities.  It may be just a matter of time before we breach the last high made in June of $1266.50 indicated by the white horizontal line.


Tuesday, September 7, 2010

Technical analysis Silver Wheaton (SLW)

Here is a 1 year chart of Silver Wheaton (SLW) with a closing price of $24.16 on Sept 7st, 2010.           (Click on the chart for a larger view)

I selected this stock as it is one of the major Silver producers in the industry. You can see their production number in the post a few days ago: Silver Producers enter profitable phase.

Here is a 2 month chart of SLW
  • SLW has made higher highs and higher lows since the July 28th low at 17.88. Bullish
  • The price is above the three moving averages of 15, 50 and 100. Bullish
  • The 18 dma crossed over the 50 dma on 8/16/10. (Indicated with a white circle) Bullish
  • The 15 day moving average is above the 50. The 50 day moving average is above the 100. Bullish 
  • The MACD Histogram is above the center line. Bullish
  • Both Stochastics K and D lines are above the 80 level. The K line has breached the 80 level 2 day ago. The 'Beta' on this stock is probably higher than your average 'blue chip' stock and your likely to see this type of movement.  Neutral
A Fibonacci retracement is drawn from the high in June 10 to the low in late Oct 09. This produced the Fibonacci 161.8 level around the $28.15 area. If we continue to see the price of Silver rise, SLW should continue to appreciate and possibly reach the Fibonacci 161.8 level.

Disclaimer: I do not own any shares of Silver Wheaton (SLW). 

Monday, September 6, 2010

XSLV Technical Analysis Sept 6th, 2010

Here is the chart of the World Silver Index (XSLV) since May of 2010 with a closing price of $19.61.    (Click on the chart for a larger view)


  • Silver has had higher highs and higher lows since the low on 8/24/10 at $17.74. Bullish
  • Silver closed above the last break low of $18.83 on 8/31/10. Bullish
  • The price closed above all three key moving averages of 15, 50 and 100.  Bullish
  • The 15 day moving average is above the 50. The 100 day moving average is above the 50. Neutral
  • MACD Histogram is above the center line and rising. Bullish
  • Stochastics both K and D lines are above 80 for the 4th day (Embedded). Bullish
  • The price is above the last rally high on 6/21/10. Bullish 
  • Intangible - In September, highest price appreciation month for Gold/Silver on statistical basis. Bullish 
XSLV was close to closing above the May 13th high of $19.85. When/if this resistance line is breached, it may provide a new support level and a new bottom to the trading range. If the price continues to rise, the 15 day moving average should cross over the 100 day moving average which is another added Bullish signal.

With the embedded Stochastics, we should continue to see rising Silver prices going forward and a possible test of the 2008 high of $21.35 (red line).

Gold Technical Analysis Sept, 4, 2010

Here is the chart of the World Gold Index (XGLD) since June of this year with a closing price of $1249.80 on Sept 4th, 2010.    (Click on the chart for a larger view)


  • Gold has made higher highs and higher lows since the July 28th low at $1155. Bullish
  • The price is above the three moving averages of 15, 50 and 100. Bullish
  • The 18 dma crossed over the 100 dma on 8/16/10. (Indicated with a white arrow) Bullish
  • The 18 dma crossed over the 50 dma on  8/23/10.  (Indicated with a white arrow) Bullish
  • The 15 day moving average is above the 50. The 50 day moving average is above the 100. Bullish 
  • The MACD Histogram is above the center line. (Crossover on 8/4/10) Bullish
  • Both Stochastics K and D lines are above the 80 level and are 'embedded'. (Green Arrow) Bullish
We are in the first week of September and the bullish seasonal trend seems to be continuing with Gold. Even through Friday was a down day, the price is still above the last break low of $1232.40.  Slow Stochastics are still 'embedded' or 'locked in', pullbacks in Gold can present a buying opportunity. Gold's all time high was produced on June 21st at $1266.50 and at it's current price, it is only 16.70 away from reaching that level.  With this trend continuing, Gold should have a new high produced within the near future.

 Above is a chart of last years (2009) bull run from Sept 2nd $952 to Dec 2nd $1217. It is speculated that fund managers want to lock in their profits and sold their Gold related assets in December. Why?  Because they publish their profit percentage the next year and want to show maximum profits for their fund.  Will it happen again this year?  Nothing is certain except for death and taxes, but on every pullback since 2002, Gold has come back and has reached new highs.

Saturday, September 4, 2010

Silver Producers Enter Profitable Phase

Here is a interesting article regarding Silver miners from Sean Rakhimov of Silver Strategies

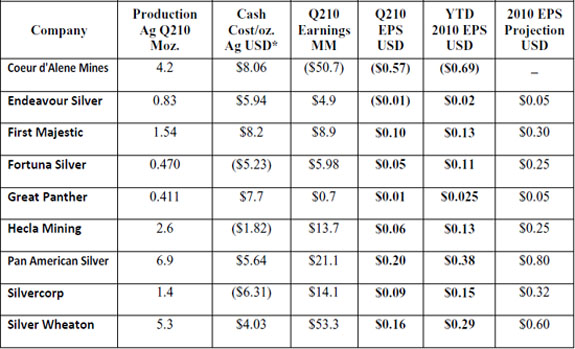
The latest quarterly (Q2, ended June 30, 2010) results from a number of producers confirm that they are now entering a phase of sustainable profits. We will look at several companies and try to make sense of the numbers as well as make an EPS projection for the calendar year 2010. This particular selection of companies was not meant to be a comprehensive overview of the entire group of silver producers, yet our intention was to provide a meaningful representation of it. Frankly, these companies are doing better than most of the rest of the group in terms of absolute earnings and comparative rate of growth versus prior years. Notable omissions include Fresnillo (LSE:FRES), Hochschild Mining (LSE:HOC) and Polymetal (LSE:PMTL) mainly due to time constraints and access to data. Companies in the table below are listed in alphabetical order.

rakh

*Earnings projections for the year 2010 are ours

There are a few wrinkles that (may) skew some of the numbers in either direction which always makes these types of summaries tricky and diminish their potential utility, but overall we tried to get as close to "apples-to-apples" basis as possible. These "irregularities" have to do with the format in which companies report their numbers. For instance, some companies report equivalent ounces of production, while others report cost per ounce net of by-product credits. Some companies expense their drilling costs while others capitalize them, still others differentiate between exploration and production drilling and split the costs accordingly. Silvercorp and Hecla report negative cash cost per ounce of silver production. This, of course, is impossible and is accounted for with by-product credits. Then again, Silvercorp shows an "average cost per ounce of silver" at $3.00 elsewhere in the financials where they also report the unit cost of production of gold, lead and zinc. We were not able to find this level of detail from Hecla so we had to backtrack and resort to using the "negative cost" number. That in turn forced us to ignore by-products completely for the rest of the companies in order to arrive at a semblance of a common denominator for the whole group. Incidentally, Silvercorp also happens to have a financial year that does not match the calendar year so we just used the latest two quarters reported. In other words, this table is far from perfect, but we hope it is useful in getting across the point we're trying to make. It was not designed to compare companies to each other, but rather demonstrate the earnings proficiency of the group.

Coeur d'Alene Mines (NYSE: CDE, TSX: CDM)
At first glance Coeur does not belong in this table as they lost a lot of money in the given period. However this company has seen perhaps the most aggressive transformation in its asset base in recent years and demonstrated a remarkable turn-around in both production numbers and health of its balance sheet. Losses shown here are necessitated by accounting standards related to its hedge book, not actual loss of funds. Lastly, due to dramatic changes in the operations Coeur has been on a roller-coaster ride in terms of its financials. E.g. in the first 6 months of 2009, CDE reported EPS of $0.27. Overall, Coeur has not answered all questions yet, but it has dug itself out of a hole it was in just a few years ago with, so is worth keeping an eye on.

Endeavour Silver (AMEX: EXK, TSX: EDR)
Endeavour's performance has been gaining steam and the numbers are looking very impressive, especially this year. The company is well on its way to clear the 4 million ounces of annual silver production mark from its existing operations next year. Endeavour also made no secret that it is on the hunt to acquire another producing or near producing mine still this year. It should also start posting better earnings since major capital expenditures on its current operations have been made.

First Majestic Silver Corp. (TSX:FR; OTCQX:FRMSF)
Perhaps the fastest growing mining company (Fortune magazine, take note), it certainly is in the silver space, particularly on profits basis. First Majestic just posted a blockbuster $0.10 EPS in Q2. Short of any serious mishap FR is looking capable of achieving earnings of $0.40/share or better in the next 12 months. Combine that with its share price of around $4.0 as of this writing and you can come up with a P/E ratio that compares very advantageously to that of Eldorado Gold (50) and most other companies in its peer group. Better yet, First Majestic has all the ingredients to double its production again from projects it already owns in the next few years without further dilution.

Fortuna Silver Mines Inc. (TSX:FVI; Lima Exchange:FVI)
Fortuna is another junior silver producer that is coming into its own as it gears up to start production from its San Jose mine in Mexico later this year. Already sporting a very attractive P/E, Fortuna is living up to its name and looks poised to make a fortune for its shareholders in the near future. It should record another significant bump up next year when San Jose starts contributing to the bottom line. We reckon the reason why both FR and FVI are overlooked by investors is their relatively small market cap, short profitability track record and absence of listing on a major US exchange. But that is changing before your eyes so don't expect these two companies to be valued as they are presently beyond this year.

Great Panther Silver Ltd. (TSX:GPR)
Great Panther Silver has also been clawing its way into profitability. While its production currently is still under 2 Moz/year, GPR is already profitable and has made tremendous progress from where it was a couple of years ago. The company is putting a lot of money into development of its mines and has reported some encouraging gold intercepts from recent drill programs. The company is also attractively valued relative to its peer group and is looking to grow its production. Inversely, if Great Panther continues to be valued at present levels, it may become an acquisition target itself, which would spell good news for shareholders.

Hecla Mining (NYSE: HL)
In our opinion, Hecla is the perennial under-achiever of the group (during this cycle). It missed numerous opportunities to take leadership in the silver sector that we are aware of. That said, the company is doing fine, thank you very much. The acquisition of the balance of Greens Creek from Rio Tinto - though costly at the time - is now paying off handsomely for Hecla, its greater (over 50%) exposure to base metals notwithstanding. The company has a solid balance sheet, well established name and history, long time NYSE listing and is profitable again. Despite losing some of its top brass in recent past, the company still retains a deserved reputation of one of the best underground miners. In this investment environment Hecla finds itself in an enviable position relative to the rest of the market.

Pan American Silver (NASDAQ: PAAS, TSX: PAA)
We have long since christened Pan American Silver "the Cameco of silver sector." That is more subtle than it may first appear. Cameco is the undisputed leader of primary uranium producers and has been for years. While Pan American may not have the same level of influence in the silver space, it has been the leader of the group, especially in the current cycle. Pan American is likely to emerge as the consolidator in the silver sector gobbling up smaller companies along the way. It started to pay dividends to shareholders this year - another sign of maturity and prosperity. For the moment we can't find many faults with this PAAS and hope it will stay that way.

Silvercorp (NYSE: SVM, TSX: SVM)
Silvercorp is a story of remarkable success and another candidate for the fastest growing mining company title at least with respect to previous five years. The company makes loads of cash and pays one of the highest dividends among precious metal companies. The only problem Silvercorp has is sustaining the same growth rate as it enjoyed in the past, and that is a good one to have. In the last couple of years the company has been actively working to diversify its asset base geographically into North America and possibly South America. Expect surprises on the upside from SVM.

Silver Wheaton (NYSE: SLW, TSX: SLW)
Silver Wheaton is an old favorite with the least well-understood business model in mining. Why? Because they created it, literally devised it. In essence it's a royalty company that, in addition to initial purchase of the royalty, was smart enough to cover the cost of production of by-product silver at the time of delivery, also known as COD. Thus greasing the wheels towards many deals that would otherwise be closed to traditional royalty transactions, SLW has amassed a substantial portfolio of - what it calls – royalty streams or silver "streams," which is again, silver produced as by-product of mining other metals, such as copper, gold, zinc, etc. We think the reason Silver Wheaton has been so successful is because they made the transaction easy for the seller to consummate and execute. They made the process clean and simple in accounting terms AND they cover your expenses when you actually pay up (deliver the silver). Silver Wheaton deserves more ink than we can give it here, but at last count they had pre-paid for some 40 Moz. of annual silver production for years to come, for which they will have to shell out an additional US$4/oz. COD. Not a bad gig considering that silver is trading at $18 and is sooner going to $50 than $5. From here on it's an accounting exercise, there is not much else to do, if they so chose. If they closed shop (of a total of dozen people at last count) tomorrow and instructed their banker to direct-deposit incoming checks SLW should reach 40 Moz. of annual silver production (in the sense that they will receive it) by 2013. And that is the "minimum" case scenario. After all, these chaps didn't get there by sitting on their hands. They will find ways to add value. Just in case we're not clear on this one, we're biased towards SLW. We started liking it when it was still Chap Mercantile. We like it more today than we did back then. So what if Argentina is trying to pull the rug from under Barrick's Pascua Lama project? Barrick is still on the hook to deliver the silver.

To Sum It Up

You probably figured from this discussion that we're bullish on silver price in the longer term, but we're even more bullish on silver stocks in the intermediate term. That is to say, we're not sure when the next move up in silver will come about, but we're on record forecasting that during the next leg up silver should register a high somewhere between $30 and $50. Sure, it's laughable. They also laughed when we called silver to get above $10 an ounce. The beauty of this situation is that these days you don't need to be a silver bug to invest in these companies. You don't need to convert, become a "believer." Simply check those earnings and stick with the one(s) that rub(s) you right. See where else in the market you can find profitable companies and for how much longer. The silver party is just getting started.

Wednesday, September 1, 2010

Gold (XGLD) Technical Analysis September 1st, 2010

Here is the chart of the World Gold Index (XGLD) since May of this year with a current price of $1248 on Sept 1st, 2010 at 08:30am PST.    (Click on the chart for a larger view)

  • Gold has made higher highs and higher lows since the July 28th low at 1155. Bullish
  • The price is above the three moving averages of 15, 50 and 100. Bullish
  • The 18 dma crossed over the 100 dma on 8/16/10. (Indicated with a white arrow) Bullish
  • The 18 dma crossed over the 50 dma on  8/23/10.  (Indicated with a white arrow) Bullish
  • The 15 day moving average is above the 50. The 50 day moving average is above the 100. Bullish 
  • The MACD Histogram is above the center line. Bullish
  • Both Stochastics K and D lines are above the 80 level and are 'embedded'.  Bullish
It is the 1st day of September and as expected, Gold is still in an uptrend that may be due to the seasonal aspect as well as worldwide financial uncertainty. Because the Slow Stochastics are 'embedded' or 'locked in', pullbacks in Gold can present a buying opportunity for those that believe that it still has upside potential. Gold's all time high was produced on June 21st at 1266.50 and at it's current price, it is only 18.50 away from reaching that level. If the upward trend continues, we should see a new high produced within the near future.