Sunday, January 29, 2012

Gold rally, pull back, rally

Looks like the low for Gold that was hit in late December 2011 may be the low for the next 12 months???  Everyone with a 1/2 a brain is buying Gold now, China, India, central banks, etc...  If you can debased your own currency and purchase Gold with it, wouldn't you do it?   'Print' your own currency, exchange it for US Dollars and purchase Gold.  Legal counterfeiting..... what a joke....

Daily chart of the World Gold Index going back to the high of 1915 that was produced in August 2011.


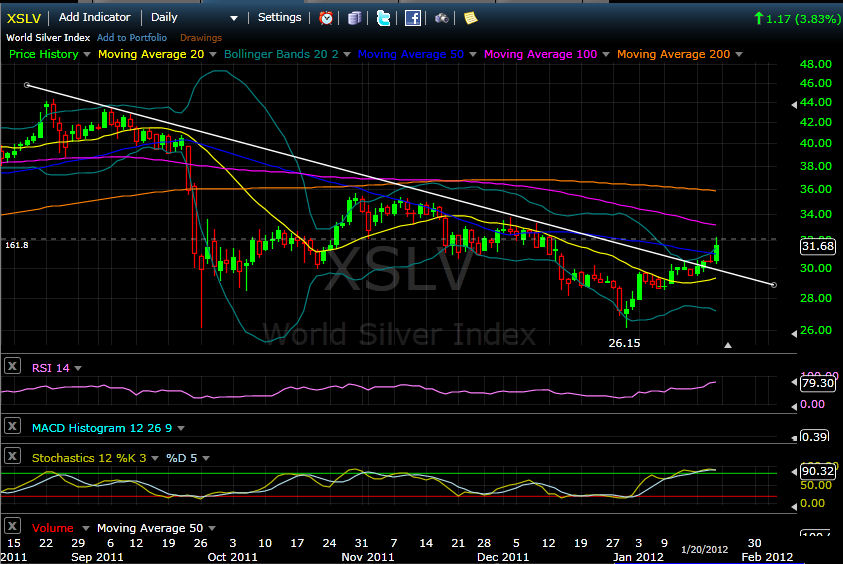
Looks like it's all green lights to the upside since the sell off to the $1523 level.
It is currently trading above the exponential moving averages of 20, 50, 100 and 200.
The 20ema is about to crossover the 50 and 100ema, bullish.
It has broken through the downtrend resistance line, bullish.
Stochastics are embedded to the upside, bullish.
It is riding along the upper Bollinger band, bullish.
RSI is overbought...  correction will occur...

The $1750 area is the 61.8% fibonacci pullback level based on the last major run-up in August.  We may hit that area, pull back for a small correction back to $1700 and head higher in an attempt to reach the old high of $1915.  We may see this before May of this year...?  Then pull back for the summer months until Aug/Sept rolls around...   We'll see, no one has a crystal ball.  If someone has one, there is a crack in it...

Silver should follow Gold's path to the upside.  The Gold Silver Ratio has been dropping with this early year rally and is current at 51.15 from a high a few weeks ago of around ~59.

The Gold and Silver miners are also rallying to the upside.  Quarterly earnings should propel the stocks higher in the coming 1st and 2nd quarters.

Thursday, January 26, 2012

David Morgan interview at Cambridge House

The Silver Guru, David Morgan gives an interview while at the Cambridge House Investment Conference.


At the end of the interview, David mentions that he is invested in a company that supports mining companies.  I am not a current subscriber to his newsletter so I do not know which company he is talking about. I did talk with a company at the SF Hard Assets Conference last November which was Energold Drilling.  They rent drill rigs to mining companies and from what the spokesperson told me, they were really busy renting and flying in drill rigs around the world.  They trade on the Canadian venture exchange, ticker EGD. For the U.S. it is traded on the Pinksheets market as EGDFF.


Not too shabby, a 28% gain over the past year and a nice move up since the SF Hard Assets Conference in late Nov............   This is not a buy recommendation as I am not a registered investment adviser or CFP.   Disclaimer:  I do not own any shares of Energold Drilling at the time of this writing.

Wednesday, January 25, 2012

Gold Silver Pop, HUI analysis

After the fed mention that interest rates will be low until 2014, both Gold and Silver popped to the upside.  Gold was up $44.40 to $1710 (2.66%), Silver was up $1.22 to $33.27 (3.81%).  This may be the start of a solid 1st quarter upside rally...

As far as the Gold and Silver stocks, here is a weekly chart of the HUI


The HUI has been in a sideways consolidation since the 4th quarter of 2010.  With both Gold and Silver prices higher than the 2010 prices, earnings for mining companies that are in production will be able to beat the 2010 and 2011 quarterly and yearly earnings.  This should be enough to spark the miners to the upside sometime within the 2012 year.

A fibonacci retracement is drawn from the run-up in 2003 and the 423.6 level is around the ~735 area.  This may be the next stop/resistance area for the HUI index.

Some have speculated that because of the Gold and Silver ETF's, the interest in mining stocks have gone down.  There is less risk with the ETF's compared to the risks of holding onto a mining company which can report many negative items and issues with regards to their mining operation.  There are risks with the ETF's, but those that are invested in them are most likely trading them and not holding them long term. If the ETF's start a divergence from the bullion prices, the hedge funds and all those on Wall Street will have their finger on the mouse button to exit first asap.

You also hear many analysists state that Gold is in a bubble and that it is going down.  If these fund managers believe that Gold is in a bubble, do you think they will invest in a Gold or Silver miner?  Probably not...  

Monday, January 23, 2012

Gold Silver Ratio

Silver has been outperforming Gold over the last few trading sessions and is seen as the Gold Silver Ratio gapped down towards the lower part of the sideways range and below the bottom trend line.  It is now also below the 20 and 50 day moving averages.

 
A few weeks ago, there is a post on the divergence between the rising Gold Silver ratio and a declining RSI, which suggested a lower ratio.  Well, we now have a lower ratio, but will it continue to decline?  It needs to drop below the last significant low which was around the 48.5 area indicated with the orange horizontal line.

The MACD and RSI are also on the decline, so it looks like a lower ratio may be realized within the next few days/weeks.

Saturday, January 21, 2012

Silver Jan 20th - speculators coming back?

Friday was a pretty good day for Silver compared to the past several months of the downwards trend.  The crooks at the bullion banks, CME, CFTC, hedge funds, ect.. probably are taking positions on the long side now.  At least until they decide to short and bring the market back down.


Silver is now above the decending bearish trend line and above both short term and mid term moving averages. (20 and 50)  Its trading near the upper bollinger band which may continue for a few more days, then a pullback within the bands possibly late next week. The stochastics are also above the 80 level which shows signs of real strength in the bullish move.

The high on Friday also hit the 161.8 fib level and then pulled back. The fib is drawn from the lows at the start of the bull market to the peak in 2008 which is the 100% level.  Getting over this level would be good for those that are bullish.

Those that were short had to make a decision on Friday to cover which part of the reason for the strong move up.  Another factor is the European debt issue that will become a major issue going forward.  In 2008, Bear Sterns and Lehman Bro's took the market down, this time it may be entire countries.

Thursday, January 19, 2012

Dow Gold Ratio - Long term bearish

In 1980, the Dow/Gold Ratio hit a bottom of close to a 1:1 ratio with the Dow and Gold around the 850 level. Here is a long term chart provided by sharelynx.com which depicts the downtrend with this ratio since ~2000.

The ratio has pierced the green upwards channel to the downside and is currently at a ratio of ~7.6.  Many believe that this ratio will equal the Dow for a ratio of 1:1.  This may happen when (if) Gold goes into a parabolic frenzy with the Dow flat or dropping.  Gold can be stable with the Dow crashing which is also a possible scenario.

A 3 year chart which shows the decline in the ratio:


Some people are looking at this ratio as a signal to exit the Gold market.  I have heard one CEO of a mining company mention that he will start lightening up on his Gold positions when the Dow/Gold ratio is 2;1, then exiting his remaining position in increments all the way to the 1:1 ratio.

He stated that he would purchase undervalued assets like Real Estate at that time.  Sounds like a good plan, especially if you can pull the trigger and execute.  No one really knows what is going to happen with the price of Gold / Silver, especially when the governments around the world seem to make new laws on a whim. 

Monday, January 16, 2012

Gold Silver miners lagging bullion, for how long?

Since the 2008 financial crises, the Gold and Silver miners have lagged the bullion price quite a bit over the last several years.

Here is a 5 year daily chart of the (evil) ETF GLD and the Van Eck Gold Miners ETF GDX. 

Over the last 5 years, GLD has returned 164%, the GDX has returned 45%.   You can see that the GDX started to diverge from the gold price at the end of 2007, crashed in 2008 and has not recovered to the same level as the bullion price.

The top 10 holding for the GDX are:
A full list of Gold / Silver miners can be downloaded at the VanEck website.   Will the Gold / Silver miners ever catch up to the bullion price? (As far as year over year returns?)  I believe that they will, but we all need to be patient. I know most people are tired of hearing that and I am as well, especially because I am a holder of select mining companies. (Long)

One theory is that when Gold is in the latter part of stage 3, there will no longer be any physical Gold or Silver to purchase.  If people still want to invest in this market, they can with the miners. They are essentially companies with money in the ground, it's a matter of extracting it.  One could invest in an ETF, but by the late 3 stage of this bull market, the ETF's may have a significant downside divergence from the phyiscal metal prices. (Which may keep people away from investing in them)

With Gold trading above $1650 and Silver above $30, the miners should continue to produce outstanding quarterly earnings reports. 2012 may be the breakout year for the bullion miners.... time will tell.

Friday, January 13, 2012

Max Keiser interviews David Morgan

Max Keiser Interview


Kitco Interviews Rob McEwen of US Gold and Minera Andies

Thursday, January 12, 2012

Long term Gold

Monthly chart of the World Gold Index going back to the lows in 2001.  A fibonacci retracement is from the lows in 2001 to the peak in 2006.  This projects a potential top / major resistance at the 423.6 fib level around $2275.


The white box is the range Gold has been in since the summer of 2011 and is consolidating before the next bull move towards the $2000 level.  Short term, it is trading above the 200 dma which may indicate that the late December lows was the bottom of the downtrend.

Tuesday, January 10, 2012

Silver - Poised for 'another' move up?

Daily chart of Silver since late Nov 2011 on the 'Think or Swim' platform at 8:45am PST on Jan 10th.

On a positive note, Silver has made it's way over the 20 day moving average.  It's on a uptrend since hitting a low of 26.145 on December 29th, 2011.  The momentum indicators suggest at least a short term rally from here.  The next resistance will be at the 50 day moving average which is close to the fibonacci 23.6 retracement level of $31.81.

Hedge funds and bullion swing traders may be accumulating positions for this trend up.  Gold is currently trading up $27 at $1635 an ounce.

Saturday, January 7, 2012

Gold Silver Ratio

1 year daily chart of the Gold Silver ratio with a 20 and 50 day moving average.

The RSI indicator above has a peak in late September 2011 and another during the latter half of December 2011. The trend line connecting these two points in on a downward trend, but the ratio depicted in the chart below is on a bullish uptrend.

This is what many technicians call a divergence which may signal a decline in the ratio going forward (?)  When? It may be a little while as Silver needs more speculators to come into the market to push the price back up over the $30 level and then past the $40 level (again). 

Hedge funds are most likely waiting for the Silver chart to start producing higher highs and higher lows before they invest capital back into this market.

Thursday, January 5, 2012

2011 Year end returns bullion and mining indexes


For Jan 5th, Gold closed at $1621 and Silver at $29.37.  The short term downside may be over???  It is possible that the bullion banks may be setting up some long positions in the metals?  Swing traders may want to take a look into solid mining companies that have been beaten down over the last quarter. There is quite a few with significant upside potential.

Monday, January 2, 2012

Returns for Gold and Silver over last 11 years

Review of the returns for both Gold and Silver over the last 11 years, plus the Gold Silver ratio.