Just a quick clip with Jim Rodgers on a the Asian CNBC station. Same story, buying more Silver and he suggests that investors in Silver do not sell.
Thursday, March 31, 2011
Wednesday, March 30, 2011
Chart of the day - Gold US Dollar ratio
Here is a 3 year daily chart of the Gold / US Dollar ratio. (The Gold price divided by the price of the US Dollar Index)

Since the financial crises in 2008, the ratio has been in an up, pullback, consolidate, up market with higher highs and higher lows. The ratio just broke above the highs in late 2010 and will most likely head higher going into the latter part of this year.
Just like the US Dollar / Silver ratio chart below, there are 3 factors which cause the ratio to move higher:
Gold flat, US Dollar declining
US Dollar flat, Gold rising
Gold rising and the US Dollar declining - Current trend
For reference, here is a 3 year chart of Gold (Dotted line) and the US Dollar (Black line)

OK, so the ratio is heading higher...what does it mean? The value of Gold is appreciating against the US Dollar - which is good for those that own Gold. But inflation will continue with higher food and oil prices. If Gold is up 17% for the year and Inflation is up the same amount, we have just kept up with inflation.
So how can we get ahead of inflation? Mining companies may provide one way to do so, but a lot of due diligence is necessary. One way to take away the volatility of owning an individual mining company is to own a mining ETF or mutual fund. There are plenty of them out there to choose from. Two of the popular ETF's are the Van Eck Gold miners index GDX (34% gain in 2010) and the junior's GDXJ (67% gain in 2010)
Tuesday, March 29, 2011
Chart of the day - USD Silver ratio
Here is a 3 year chart of the US Dollar / Silver ratio. (How many ounces of Silver will purchase the US Dollar Index) It currently takes 2.05 ounces of Silver to equal the US Dollar Index.
 You can see that the trend has been consistently down since late 2008 after the financial market crash. The ratio is trading under both 50 and 200 day moving averages and looks like it is heading lower at a dramatic pace.
Three scenarios for a dropping ratio:
Silver flat and the US Dollar declining
US Dollar flat and Silver rising
Silver rising and the US Dollar declining - This is the current trend (Seen in the chart below)
The RSI is oversold and has been on the lower section of the indicator for the past 6 months with the exception of the January 11 correction.
For reference, here is a 3 year chart of both the US Dollar Index (Dotted Line) and Silver (Solid Black line).

It's a matter of time before the US Dollar/Silver ratio is 1:1. At what price and time will it occur? It's anyone's guess as no one can say for certain. (I do not think that there are very many people that actually monitor or review this ratio). It is always interesting to make a prediction, so I'll say that the 1:1 ratio will occur at 65 and by the 4th quarter of 2012.
Monday, March 28, 2011
Thursday, March 24, 2011
Raw Gold shortage in China?
As far as the markets, we had a volatile one today with a intraday high for Gold at $1449 and a low at $1423. Silver had a decent range as well with a intraday high at $38.19 and a low at $36.84. Mostly profit taking and maybe new shorts coming into the market with the new high for Gold and a 31 year high for Silver. The short will be covering again soon as they know that the bulls and demand will take over.
Many know that China is purchasing both Gold and Silver at a brisk pace, they have high inflation and need to protect the money they have. Here is a short video on the raw Gold shortage in China.
Tuesday, March 22, 2011
Short interview with Rob McEwen
Here is Rob McEwen, the former CEO of Goldcorp in a short interview at a investment conference. $2000 Gold and a top at $5000 is what he has been saying. (And he is sticking to his guns)
Monday, March 21, 2011
March 21st Gold

World Gold Index on March 21st, 2011
Is a 5th time a charm? Will Gold hit that glass resistance ceiling again and break down under $1400 again? The last break low was shallow and was slightly higher than the previous pullbacks which is bullish for Gold.
The moving averages are lined up in a bullish pattern with the price higher than the 15, 50 and 100 day moving average.
The MACD is starting to rise toward the center line.
Stochastics K line has crossed over the D line and heading upwards.
With the US Dollar weakness, Gold may be able to reach the $1500 level in April, 2011. For Silver, a 40/1 ratio (Which is close to where it is now) will put it at $37.50

US Dollar Index on March 21st, 2011
Do you see anything bullish about the chart above?
The price is under the 15, 50 and 100 day moving average. With 15/50, 15/100 and 50/100 bearish crossovers indicated with red arrows.
The price is dropping along the lower bollinger band
The price pierced the last major low on November 4th, 2010 of 75.63.
China holds quite a bit of US Dollars and they are watching it drop. Do you think that they are concerned? Geitner went to China back in 2009 to reassure them that the dollar was strong..... I have a feeling that they did not believe him.
The Chinese have already been diversifying out of the Dollar to buy Gold and Silver, but they have to do it slowly or the dollar will most likely drop dramatically hurting them even more. They have a problem and I'm sure they do not know what to do other than to accumulate more Gold. The price can only be suppressed so much, so look for huge days to the upside within 1 or 2 years.
Saturday, March 19, 2011
When will Gold break out?
When is the next leg up for Gold? When will it break? Gold has had a quadruple top and seems like the bears take over once it reaches the $1430 area. Silver has been a better performer over the past few months and will most likely have better returns for the remainder of the year.
So when will Gold break out of it's $100 dollar trading range of $1330 to $1430? The US Dollar Index may let us know when it will happen.
 Here is the US Dollar Index since late September of 2010. The last price was at 75.72 and is in a downtrend with the price under the short term 15dma and the mid 50dma. The RSI is also heading down with lower highs. It is close to breaking the last support area seen in the first week of November 2010. If this level is broken, it can be the catalyst for the next level for Gold.
 Another potential reason for Gold to appreciate into the next month is with the Seasonals. Based on the last 15 and 34 year average, Gold will typically rise towards the latter part of March. Add the US Dollar dropping and the Seasonals and we may have the right combination for the next bullish move for Gold.
The next obvious level for Gold will be the even number of $1500. A 40/1 Silver Gold ratio will place Silver at $37.50. Keep your eye on the US Dollar Index in the coming week(s)...
So when will Gold break out of it's $100 dollar trading range of $1330 to $1430? The US Dollar Index may let us know when it will happen.


The next obvious level for Gold will be the even number of $1500. A 40/1 Silver Gold ratio will place Silver at $37.50. Keep your eye on the US Dollar Index in the coming week(s)...
Wednesday, March 16, 2011
Gold March 16, 2011 - Potential end of year targets

The vertical white line to the right side of the chart is the end of the 2011 year. The upper trend line ends at that point just over the $1600 level. That is just $200 over what the price is now and is a conceivable ending price for 2011, it would also be the 11th straight year that Gold has been up.
Continue to watch the US Dollar Index as it has been weak lately trading near the lower end of it's range.

If the US Dollar continues it's decline, expect $1500 Gold soon. If it continues in it's trading range, Gold will most likely continue to have a major resistance level just over $1400 and trade flat through the summer.
If Gold is at $1600 a 35 to 1 Gold Silver ratio places Silver at $45.7 area. The ratio is currently around the 40 area and if it should continue it's decline, 35 to 1 ratio is a definite possibility at the end of this year.
Dollar cost averaging into both Silver and Gold is a great way to protect yourself from the oncoming inflation.
Tuesday, March 15, 2011
March 15th Silver
Our hearts go out to Japan and hope they have a quick recovery from the earthquake, tsunami and now nuclear plant issues.
Below is a link to the Google page for donations to Japan:
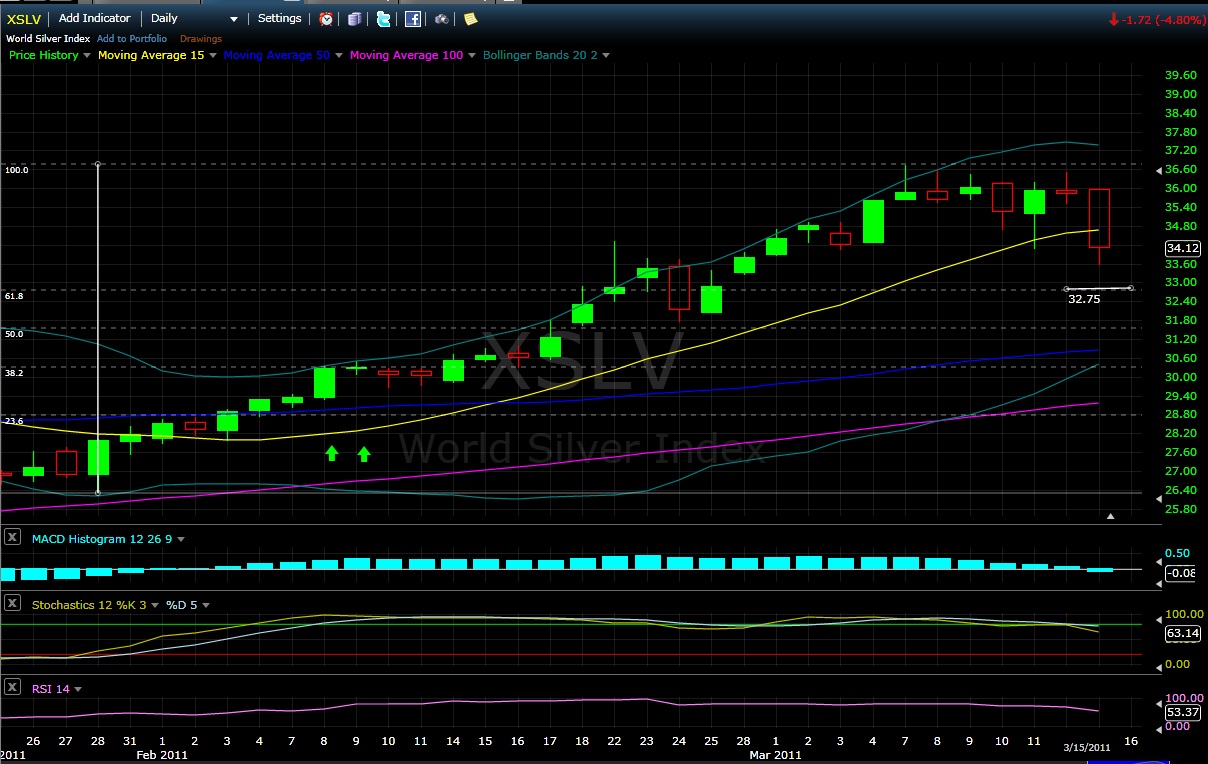
A pullback was eminent even without the issues in Japan as the Silver run-up was $10 within 5 weeks!
Silver has dropped below the 15 day moving average and the next level of support may be the 61.8 fibonacci level which comes in around the $32.75. A 50% drop of the current rally is at $31.50 with the 50 day moving average at $30.86.
The MACD Histogram has dropped below the midpoint and the Stochastics K line in decline.
For some, this pullback may present an opportunity to accumulate more Silver and Gold.
Sunday, March 13, 2011
Is QE3 on the way?

Weekly chart of the S&P 500 from September 2008
Do you own mining stocks along with your physical Gold and Silver? If you do and are in the US, you are reliant on the stock market 'health'. In general, we would like the stock market to either remain in a trading range or continue to head higher. If the markets remain 'healthy', the select Gold and Silver stocks should outperform the spot price of both Gold and Silver on an annual basis.
When the financial markets were crashing in 2008, it took every equity down with it. Even with Gold down 30%, some of the junior miners were down 90%. You will want to prevent this from happening to your portfolio should this scenario happen again in the next few years. Even though some Junior miners had a proven and probable reserves of millions ounces of Gold, the margin calls forced mutual funds, hedge funds and individual investors to sell their stocks dropping many of them to penny stocks.
So will the markets hold up with unemployment at 9%? Oil over $100 per barrel? Gasoline over $4 a gallon? An unstable Real Estate market? Rising food prices?
The TARP and QE2 programs have supported the markets since March of 2009. You can see from the S&P500 chart above of when the TARP program ended in May of 2010, the market started to decline. Ben B announced Quantitive Easing 2 program in August of 2010 and proceeded to pump money into the financial markets. But QE2 will be ending in June 2011. What will happen then?
If the markets start a decline after June (or before), maybe Ben B will announce QE3? The municipal bond market is also on unstable ground and some individual states need money soon which will be another justification for QE3.
2012 is also a election year for the president. Do you think that Mr. Obama will get re-elected if the stock markets crash before November 2012? And everyone with a 401k is down 50% again just like in 2008/2009?

Mr Obama mentioned early last week that he will tap the US Oil reserves if the price continues to increase which increases the gasoline price. I'm sure he knows that if gasoline is $5+ a gallon, he will start loosing voter confidence in his direction of America. Some people may think that he is not doing such a good job with out of control inflation at the pump and grocery store.
So Obama's job is to TRY to keep a 'lid' on the Oil price and keep the stock markets from crashing before November 2012. After that, anything can happen.
Based on the above scenario, QE3 looks like a definite possibility.
Thursday, March 10, 2011
Gold Dow Ratio

3 scenarios from where we are today:
- With the debasement of fiat currencies worldwide, the Dow may continue to head higher (With all of those paper dollars) and Gold will out pace it to eventually hit the 1:1 ratio.
- The Dow can remain in a trading range around the 10,000 area and Gold will continue to rise to reach that level for the 1:1 ratio.
- The Dow can decline and Gold will increase to reach the 1:1 ratio. This scenario has the highest probability of happening. At a minimum, Gold will reach $5000 and the Dow will drop to 5000.
These are two signals that the Gold and Silver markets have reached their zenith and investors will need to make a decision on what to do with their precious metals. In 1980, both Gold and Silver declined rapidly after the peak. Rob McEwen has mentioned that he will be starting to sell Gold when the Dow Gold ratio is 2:1, then take the proceeds and invest in another undervalued asset like land or real estate.
We are a few years away from the above scenario happening, but it's always good to have a clear EXIT STRATEGY on EVERY INVESTMENT that you have. Remember the saying in the stock market: BULLS make money, BEARS make money and PIGS get slaughtered.
Wednesday, March 9, 2011
The next best thing
The physical Gold and Silver market is relatively small compared to the stock markets, forex and even some multi-billion dollar companies / wealthy investors. The demand for precious metals will continue to gather popularity going forward into 2012, 2013, 2014. I think that the worldwide fiat currency system will most likely be devastated before 2015.
There will be an increasing demand for physical Gold and Silver as inflation starts gathering steam going forward. We already see $4.50 gasoline and grocery prices increasing on a weekly basis in the United States. Most of the commodities are also rising including Corn, Oil, Coffee, Sugar and Cotton to name a few. Take a look at the BAL which reflects the Cotton price:
 BAL has gone from $35 in July 2010 to a high of $117 a few days ago. If you need a some new Jeans or any clothing made from Cotton, you may want to purchase it NOW. The store price will lag the current Cotton price, but it will catch up and most items made from Cotton will increase in price going forward.
The 'light bulb' will turn on for some of the public and they will eventually start investing their savings account in physical Gold and Silver. (Mainly because they will finally realize that the dollar is dropping and inflation is killing them. They also do NOT TRUST the stock market, so mutual funds and individual stocks are not acceptable investments. Most people also do NOT have the time to swing trade and get into and out of stocks when the trade turns against them. Most people have full time jobs and cannot watch the markets all day.)
Many people will think that $2000 Gold is too expensive, so they will turn to Silver which will increase the spot price and lower the Gold / Silver ratio. This bull market is much different than the 1970 bull market because we will have WORLDWIDE DEMAND this time because of the INTERNET. The last bull market was 10 years, 1970-1980. This bull market is in it's 10th year and is nowhere near the 3rd stage. If this bull market lasts until 2015, it will be almost 15 years. (A typical commodity cycle)
This time around, people around the world will be hording Gold and Silver which will eliminate the supply. Miners will transfer their dore bars to the smelter / refiner and the coins and bars will be scooped up as soon as they hit the market. How will you get yours? Well, you already have your cache right? You were buying Gold <$800 and Silver <$15. (And continue to accumulate)
How will the 'public' get Gold and Silver when it is hard to find or buy? They will buy 'The next best thing', the stock or ETF: SLV, SIVR or PSLV. If SLV does not 'diverge' lower from the Silver price, it may actually go higher than the spot price due to demand. (I know the hardcore physical guys would hate this...)
After the ETF's, Silver and Gold miners may be next on their list of possible places to park their money, especially if the shares are still appreciating. (When the stock markets are declining) Or will the Dow Jones be at 50,000, S&P500 at 5,500 and Nasdaq at 11,500 due to all the 'money printing'?
It's a good thing that you already have your cache of physical Gold and Silver because they are not only going higher in price, but because it will be hard find and purchase in a few years.
There will be an increasing demand for physical Gold and Silver as inflation starts gathering steam going forward. We already see $4.50 gasoline and grocery prices increasing on a weekly basis in the United States. Most of the commodities are also rising including Corn, Oil, Coffee, Sugar and Cotton to name a few. Take a look at the BAL which reflects the Cotton price:

The 'light bulb' will turn on for some of the public and they will eventually start investing their savings account in physical Gold and Silver. (Mainly because they will finally realize that the dollar is dropping and inflation is killing them. They also do NOT TRUST the stock market, so mutual funds and individual stocks are not acceptable investments. Most people also do NOT have the time to swing trade and get into and out of stocks when the trade turns against them. Most people have full time jobs and cannot watch the markets all day.)
Many people will think that $2000 Gold is too expensive, so they will turn to Silver which will increase the spot price and lower the Gold / Silver ratio. This bull market is much different than the 1970 bull market because we will have WORLDWIDE DEMAND this time because of the INTERNET. The last bull market was 10 years, 1970-1980. This bull market is in it's 10th year and is nowhere near the 3rd stage. If this bull market lasts until 2015, it will be almost 15 years. (A typical commodity cycle)
This time around, people around the world will be hording Gold and Silver which will eliminate the supply. Miners will transfer their dore bars to the smelter / refiner and the coins and bars will be scooped up as soon as they hit the market. How will you get yours? Well, you already have your cache right? You were buying Gold <$800 and Silver <$15. (And continue to accumulate)
How will the 'public' get Gold and Silver when it is hard to find or buy? They will buy 'The next best thing', the stock or ETF: SLV, SIVR or PSLV. If SLV does not 'diverge' lower from the Silver price, it may actually go higher than the spot price due to demand. (I know the hardcore physical guys would hate this...)
After the ETF's, Silver and Gold miners may be next on their list of possible places to park their money, especially if the shares are still appreciating. (When the stock markets are declining) Or will the Dow Jones be at 50,000, S&P500 at 5,500 and Nasdaq at 11,500 due to all the 'money printing'?
It's a good thing that you already have your cache of physical Gold and Silver because they are not only going higher in price, but because it will be hard find and purchase in a few years.
Tuesday, March 8, 2011
Silver March 8th

Stochastics are embedded to the upside, so higher prices are possible. Once the K line drops under 80, we may see the start of a correction or consolidation. The RSI is also over 70 which is Overbought and the likelyhood of a pullback/consolidation sometime within this month is highly probable.
There is no financial instrument that continues to head higher for a long periods of time. When this does happen, its just a matter of time before the bust happens so a correction is 'healthy' for any financial instrument. We are a few years away from the mania stage in precious metals.
Monday, March 7, 2011
Quadruple top for Gold

Chart of the World Gold Index over the past 4+ months
A quadruple top just over the $1400 level is seen for Gold since mid November of 2010. While it is providing a significant resistance level, it is good that Gold has based between 1330 and 1400 for 4 months. This provides a solid base for the next rise in price to the $1500 level and beyond.
Gold is over the short, mid and long term moving averages - Bullish
Gold is trading at the top range of the MACD Histogram - Neutral/Bullish
Stochastics are embedded, both K and D lines over 80 - Bullish
Is a 4th time a charm? Or will Gold head back down to the $1330 level?
Bullish factors for Gold
Turmoil in the middle east/Egypt/Libia that will not end anytime soon
Continued debasement of the fiat currencies (US Dollar is dropping)
China / India / Central bank / Investor demand
Gold should be able to break through the ~$1430 / 40 resistance level this time around. It's just a matter of time.
With inflation coming on fast, you may want to think about storing food for the long term. Rice, Pasta, Wheat, etc... Look on Youtube for 'Food Storage'. You can purchase 5 gallon buckets and Mylar bags and store food between 10-15 years.
A 50 pound bag of rice is $35 now. Next year it could be $45, then $55, $65, $75+. You can buy it now rather cheap, or wait until next year and the year after when it is much higher due to Oil prices and inflation.
Friday, March 4, 2011
Next fibonacci levels for Silver
Here is a short vid on the next potential highs for Silver going forward.
Wednesday, March 2, 2011
Silver is starting to make the news stations
Silver is getting more and more exposure on the news and on TV. Soon you may start seeing Cash for Silver commercials when it is over $45 an ounce. The cash for gold kiosks at the mall will also pay you cash for your Silver...
Tuesday, March 1, 2011
March 1st Silver, new 30 year high

Silver is producing higher highs and higher lows since Jan 28th low of $26.30. Bullish
Silver is trading above the short, mid and long term moving averages. Bullish
MACD histogram is trading in the upper band. Bullish
Stochastics lost the embedded status on 2/24, but the K line has crossed over the D line and is heading back over 80. Bullish.
Silver is trading near the upper bollinger band. Bullish/Neutral - for traders.
Short term - Bullish
Medium term - Bullish
Long term - Bullish
The Gold / Silver ratio continues to drop and IF it should continue at this rate, it may be around the 30 level at the end of the year. If Gold rises to $1600, a 30/1 ratio would put Silver around the $53 area.
You can make some decent $$$ just by investing in the Silver market with a little timing. Some PM investors will only purchase the physical metal and that is a great way to start and is a good way to preserve your capital from inflation. But that is it, a hedge against inflation.
If you want higher returns, you'll need to leverage your money. (The risk is also much higher). You can leverage your money with Silver miners or the double long ETF AGQ which returned ~160% last year.
I got into this trade near the bottom of the Silver correction in late Jan. This trade was made on Feb 2nd, about a month ago.

For Silver miners, you can get a comprehensive list in the GlobalX ETF SIL. (Google them) They have all of the major Silver miners in the fund. SLW, SVM, AU, EXK, PAAS, CDE, SSRI, MVG, HL to name a few.
March has typically been a down month for both Gold and Silver, we will just need to sit back and watch if this seasonal trend will continue this year. With all of the turmoil in the middle east, a flock to the PM's may continue this month.
Subscribe to:
Posts (Atom)