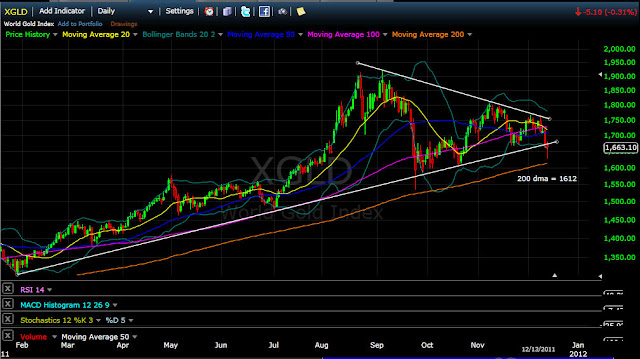
World Gold Index for Dec 13th, 2011. The wedge pattern was pierced to the downside today and may be heading towards the 200 day moving average of 1612. If you look over the past 10 years of how Gold has traded, it has been a buying opportunity each time it has reached the 200 dma.
10 year chart courtesy of Kitco.com, the green line is the 200 dma, blue is a 60 dma.
The average Gold price appreciation over the last 10 years is around ~17%. As of today, Gold is up approximately 19.7%. It is trading 2.7% above the last 10 year average.
Should Gold continue to trend down below the 200 dma, it may be a good time to accumulate and add to your current position. (We need to find more fiat paper to exchange!)


No comments:
Post a Comment