Sunday, March 31, 2013

Will April be better???

Weekly Gold chart going back to late 2004, consolidations are boxed in white.  You can see that these consolidations have been well over 1 year period of time.  The box between 2010 and 2011 is not a true consolidation as the price drifted upwards during that time.

The current price is closest it has been to the 200 week moving average since the 2008 financial meltdown.  Can it consolidate more?  Gold may drop to the bottom of the range before going for a run to the top of the range.  Maybe April will be a better month?

Weekly Silver chart going back to 2004 with major trend lines in blue showing a double upwards channel. The parabolic spikes are clearly seen with major sell offs right after.

Silver has been in a major consolidation period since the sell off in May 2011. Short term, it is bearish as it's trading below all of the moving averages, 20, 50, 100 and 200.  It has also breached the major bottom trend line which is not a bullish sign.

With Cyprus in the news, I would think that more people would become aware of what central banks around the world are doing. (Debasing and stealing for their own benefit at the expense of the people)

If Silver does not get a decent bid in April, expect more of the same trading range going forward. I would not be surprised to see $26 again for the 5th time?

With the Fed and their magic money machine (Digital is their weapon of choice), they can continuously supply the too big to fail banks with digital fiat to suppress the price on the Comex.  Based on what I've seen over the years, I believe that the _cartel_ is stronger than most people think. IMO, they will fight this particular commodity down to the last day, expect a slow grind going forward.  (Unless they decide to make a few $$$ going long before shorting it again).

Tuesday, March 19, 2013

Silver: Breakout or breakdown?

3 year weekly chart of Silver (SLV in this case)


Observations: If the silver price continues to trade sideways to slightly up, the recent RSI low is higher than the previous low set around June last year. This gives the chart a rising RSI on a weekly basis. (If the price hold up)

The Silver price is clearly in a downtrend with support around the $26 level. A declining price with a rising RSI is a divergence in the short to mid term, this eventually suggests that the price will eventually rise, but when?  No one really knows for sure.

The weekly slow stocastics are oversold and may be at the beginning of a bullish D/K crossover.

Also noted is that the Silver price is closest to the 200dma since Feb 2010, over 3 years ago. (Not shown on the chart) The price at that time was in a one month downtrend, then returned to trade around the $18 level and six months later started the massive rise to 48+ into 2011.

Fundamentally and in my opinion, Silver is grossly undervalued.  Based on the US money supply, industrial demand, investor demand and the amount that is mined every year. 

With the Cyprus banking news (fiasco/robbery), many people in the European community may become a bit wary of their currency and where they keep their 'money'. This may be a hint of things to come with other countries??? Those that are proactive may be seeking a safe place to put their 'money' which is bullish for the precious metals. 

Monday, March 11, 2013

Silver ready for a bounce?

Here are my observations on the technical's of the Silver market at this time. It has been in a consolidation period since the blow off of 5/11 which will be almost 2 years.

Weekly Silver chart from Jan, 2011.

Indicators on this chart (I know it is a bit 'busy'):
Moving averages of 20, 50, 100 and 200.
Fibonacci from the last low just over $26 to the last high around $35.
Bollinger band
Major long term trend lines in light blue (Double channel)
Mid term trend line in white

Ready for a bounce???  Silver is rising out of an oversold area on the Slow Stocastics, off of the bottom of the 23.6 fibonacci retracement level and rising after bouncing off the lower trend line which is now support. (At least for the time being)

If you look at the yearly price of Silver over the last few years, it has often put in the lowest price during the first 3-4 months of the year.  Based on that, we may have seen the low price of the year already....?

I'm looking for a bounce back up near the upper trend line. (Another lower trend line is not drawn which is near the $31 level.  Resistance levels at the 20 day moving average of $29.40, fibonacci level 38.2 around $29.75, 50 day moving average at $30.60 and the 50% fibonacci retracement of $30.80.

I picked up some 'paper' Silver last week and the week before for a swing trade. You can take a percentage of profits from the paper trades and purchase physical. As many people do, dollar cost average into the metals.

Weekly Silver from 2003
The longer term Silver chart has a double upwards channel in light blue. The lower channel was just pierced which IMO makes the Silver metal undervalued just like in 2008. David Morgan has mentioned that price 'manipulation or management' can be done in the short to mid term,  but cannot be done over the long term. Well, if that is the case and you believe it, Silver is a pretty good buy if you are a contrarian investor.

Lastly on this chart is a timeline fibonacci that is started on the 5/06 spike high to the low in 11/08. The has projected a date around 4/11 which was the parabolic spike high of $49.  The next date (not shown on this chart) is near the end of Oct 13 or start of Nov 13.  Based on the fibonacci timeline, something 'big' is going to happen near this time, we shall see.........

Tuesday, March 5, 2013

Gold 1.5 year trading range+

Hello,

I'll start updating this blog once, maybe twice a week for those that want to drop by and see/read some general analysis on the PM markets.   I had (and still have) a problem with Google's adsense program which halted my interest in blogging for a while.

Here is a 3 year weekly chart of Gold which has been in a trading range since the mid to latter part of 2012. In the short term, it is still in a technical downtrend as the RSI is heading down, the MACD is under the centerline and the Slow Stochastics K line is under the D line and is in over sold area.


I continue to hold onto a core physical metal (Silver) and have a swing trading account. Over the last 1.5 years in the Gold / Silver market, only the 'traders' have made any fiat $ in these markets. Pro traders are making money going both long and short which is easy to do with inverse ETF's like AGQ for Silver, DZZ & GLL for Gold and DUST for the miners. (Most people are not going short on PM futures contracts)

With this long consolidation, I expect a rally at some point this year...?  Summer?  Fall?  I heard one guy on CNBC this morning in which he stated that Gold will be lower by the end of the year.  The fed last week mentioned that it may end QE earlier than expected as the economy gets stronger.  I'm with Peter Schiff who has stated that the Fed will not stop their fiat printing drug addiction.

Tuesday, June 19, 2012

Six Billion Dollar Bet

Six Billion Dollar Bet

He should have invested ib Gold and Silver....
Watch Six Billion Dollar Bet on PBS. See more from FRONTLINE.

Tuesday, June 5, 2012

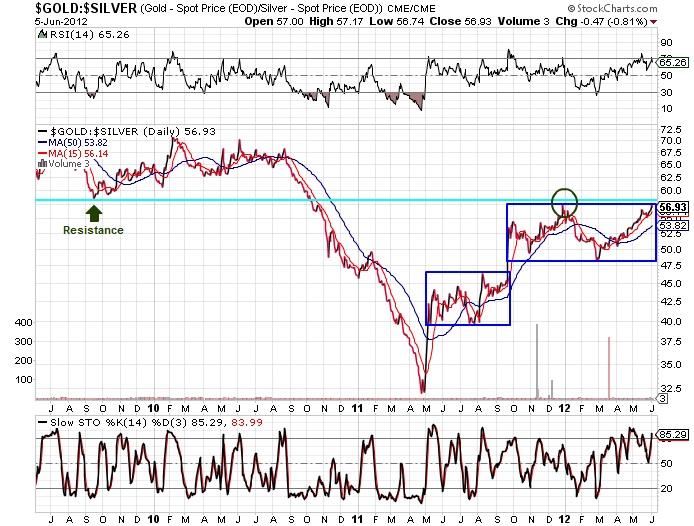
Gold Silver Ratio at upper end of range

The Gold Silver Ratio is currently around the 56-57 area which many would consider high based on the coinage act of 1792. (The Act defined the proportional value of gold and silver as 15 units of pure silver to 1 unit of pure gold.)  The ratio of Gold to Silver in the earths crust is somewhere between 15 and 20 to one, I've read that it was 18-1.
So, if one believes that the Gold Silver Ratio will eventually go down possibly under 20-1, this may be a good opportunity to accumulate or add to your position. That is if you are going to hold long term. (Which IMO is over a year and may be another 5 years for this commodity bull market).

Can the ratio go higher?  Sure, possibly 60+ depending upon how speculators see the economy as Silver is tied to an industrial metal.  Economy is bad, less demand for the metal...  at least that is how the street sees it.


Gold rallied huge last Friday and was up quite a bit more than Silver. Speculators will flock into Gold in uncertain times and will generally stay away from it's volatile brother, Silver. Gold is currently leading with Silver following.

The 56 ratio is trading near the recent top produced in late Dec, 2011.  Will a double top be produced? Both RSI and Stochastics are overbought and suggest a possible reversal to the downside. There should be major resistance to the upside just under the 60 level as noted by the low point in Sept 2009.


Sunday, June 3, 2012

Summer Rally?

Nice move in the precious metals markets on Friday June 1st due to the jobs report and the ongoing issues with Greece / Europe.

Gold was up ~$59 for the day and stopped right at the 50 day moving average. RSI and Stochastics were oversold and are heading towards the overbought area.  Technical swing traders may pile in paper gold to continue the push up.
Could May be the low for the year?  Possibly, but you just never know for sure.  Gold was trading near the bottom of the large range that was produced last year between July and early September. It will be a little while for it to pierce the 200 dma and then a crossover of the 50 over the 200.


Silver did not move as much as Gold as it was pulled up because Gold went up. Gold led, Silver followed.  When you have the RSI and Stochastics both in oversold area at the same time, there is a good chance for the investment to move towards the upside. That was the case here, but Silver still needs more speculators to invest for a stronger move to the upside.

The low produced in May was higher than the low produced at the end of 2011 which is a good sign. (Higher lows)


The Gold Bugs Index HUI had a nice day up 6.74% and over the 50dma.  Again, the RSI and Stochastics were both in the oversold area and a reversal to the upside was produced. A push over the 100 and 200dma may signal trading algorithms to take positions in the senior and mid tier miners.

The miners are trading at historic low PE's and speculators/traders are taking positions at these low prices. The street still has faith in the Gold and Silver miners as they were up as a whole while the Dow and S&P were hammered on Friday. (A very good sign)

Swing trading the GDX and GDXJ may be of interest to those that have a side trading account. (Aside from the core physical position)

Monday, May 21, 2012

James Turk & John Embry


The experts are still very bullish on the precious metals longer term. (Years, David Morgan has mentioned 2016)  The fundamental reasons for holding and investing in the PM's are still solid.  The cartel cannot suppress the price forever.


David Morgan Interview


Thursday, May 17, 2012

Gold Double Bottom

Gold has declined back to the lows that were produced in late December 2011 and had a reversal day which shot it up $34 for a close of ~$1575.


Previous posts mentioned that a potential uptick would occur due to the oversold RSI and Slow Stochastics readings.  Both are now heading in the upwards direction (Blue Squares), but will the trend continue?  Especially going into the summer months...?

Circled in Pink are the low points over the last 6 months which many would call a double bottom.  Is the 1530 area the bottom for Gold in 2012?  It's anyone's guess at this point.  It may be a good area to add to a position for those waiting to get into the market.  (And for those that do not believe that this bull market is over).

I'm expecting the trading range to continue until late August, early September.  The seasonals at that time may kick Gold back to the highs that were produced last year.

Gold and Silver stocks are trading at yearly lows, P/E ratios are low for many of the senior and mid tier producers.  When most people want to sell, the Wall Street sharks will gladly take your shares and anyone else that wants to cough them up.  Ride out this storm and if your want to get out, wait for the next oversold / Parabolic move in the HUI, GDX, GDXJ.  (This may be a while)


Monday, May 14, 2012

Gold - Bottom soon?

Gold is still in a sell off downtrend which may be bottoming out soon ?  Sometimes a stock will over shoot to the upside and to the downside before a reversal. Gold may produce a double bottom near the $1550 level which was near the end of December 2011. (Indicated with the light blue line)


If there is a breach through the $1550 area, Gold may do a 100% retracement back to the low point before last summers rally which would be near the $1475 area.

The 50 dma crossed over the 200 dma a few weeks ago indicated with the red arrow.  RSI and Slow Stochastics are oversold, so a rebound to the upside may be realized within a week?  That is unless the sell off continues and the Slow Stochastics become embedded to the downside.

This may be a good time for shorts to cover their positions? Going into June and July, more consolidation and volatility is probable.

Saturday, May 12, 2012

Bottom fishing Gold

Sell in May and go away until Labor Day, is there any truth to this?  Specifically with the Gold market?  Maybe...


Mid term, Gold is in a down trend with lower highs since the top back in August 2011.  It may retrace back to the low in December if the trend continues. No one really knows where the bottom will be for this short term bearish Gold market.  

Should it break the December low, the next significant support low is back in July 2011 just under 1500. That will be a 100% retracement from the major summer rally last year.

RSI and Slow Stochastics are in the oversold area which typically rebounds within a few days.  If the slow stochastic embeds, Gold will be heading lower.  Many see this a a buying opportunity and will be accumulating.

This consolidation period will most likely last for the next few months.  The seasonal demand for Gold in August / September may be the catalyst for the next uptrend. ?

Saturday, May 5, 2012

Gold, Silver, HUI/Gold Ratio

3 year Gold chart, the consolidation continues.  Gold is still trading under the 200 day moving average and is in a slight downtrend.  A mid term wedge pattern is formed which typically ends with a break up or down, we should see some movement one way or another within a few months...?  Possibly post summer...?


3 year Silver chart - A clear downtrend is seen with Silver as well as a mid to long term wedge pattern. It is trading below the 200 day moving average and the RSI and Slow Stochastics are near the oversold level. Similar to Gold, the price will typically break either up or down through the wedge trend lines. The question is, which way is it going to break?

If the cartel want's to cover their shorts, expect the price to break down.  They can load up on ZSL, purchase puts on SLV and short the futures contracts and make a lot of fiat. Maybe the CME will raise margin a few times to slam the price back to the low 20'ies?  Easy money when you know when the margin increases will be announced and in effect.

If Silver should get slammed, the cartel as well as others (Soro's, Carlos Slim, Goldman, etc...) will probably go long to make a few more fiat bucks. A few hundred million is pocket change for them, but they will take the profit...


Gold/HUI Ratio  (HUI Index divided into Gold)  Gold and Silver stocks are trading at lows that haven't been seen in a few years.  Why purchase Gold or Silver shares when the S&P500 is up 8.87% YTD?  (For reference, the GDX is down 14% YTD)


The long term PM charts are still in a bull market, so those with physical bullion can just go about their business without worry. The PM savings account should not be viewed in fiat currency, but in how many ounces you actually own.

Monday, April 30, 2012

Gold still in trading range

Sell in May and go away, come back after Labor Day?  Gold is still in a trading range and looks like it will be that way until some catalyst sparks an uptrend,,, or downtrend...?


Since August of 2011, Gold has traded between $1550 and $1930.  It is under both 50 and 200 day moving averages with the 50 crossing under the 200 last week. (Not bullish)

The RSI and Slow Stocastics looks like they may rebound to the upside for a trend back up.  Gold may just trade sideways until the 'seasonals' kick in which is typically the month of September. The seasonal pattern does not always come into play as last year, Gold and Silver went down for the month of September.

Short and mid term bearish, long term bullish.

As far as the Gold and Silver stocks, they should be pretty close to a bottom unless the PM's sell off for some reason. Their PE ratios are about as low as they have been for years. In a few years, we may look back at the miners in 2012 and see that they were a buy.

Wednesday, April 25, 2012

Gold = Trading range

Gold has been in a trading range which is closing in on one year.  Based on past price history, this is not unusual as a 1.5 year consolidation period has been seen over the past decade bull market.
S
1 year daily chart of the World Gold Index


Gold is trading under the 200 day moving average which is bearish. The 100 day ma crossed over the 200 day ma on 4/5/12 which is also bearish for Gold.  This can also be seen as an accumulation point for those that believe that higher prices may be coming in the mid to long term.  Over the past decade, Gold has not spent much time below the 200 day ma, we'll soon find out about the current market as May and summer is a few months away.

Here is a podcast interview from GoldSilver.com with Simon Black. He still sees the long term bull market in Gold heading higher and talks about the bubble that has been growing, debt and the debasement of fiat currencies. Also diversifying portfolios outside of the United States.

http://youtu.be/HnnTFfAOO4Y

Sunday, April 22, 2012

Silver rally or continued downtrend?

Below is a daily chart of Silver over the last 3 years.  Since the high that was produced in the early part of 2011, Silver can be seen in a technical downtrend indicated by the blue trendlines.


A technician can say that it is producing mid to long term lower highs and lower lows, the definition of a technical down trend.  Silver is also trading below the 50 and 200 day moving average which is bearish.

On the positive side (for the bulls out there), even though the chart may be seen in a downtrend, the RSI is on a uptrend. Technician's call this a divergence and may lead to higher prices sometime in the future...? 

See the question marks under the green upward arrow...   Why the question marks?  Although this divergence is seen as a potential upwards bias in the future, price manipulation can swing prices and investor psychology away from this market faster than dropping a hot potato. 

Why would anyone invest in the Silver market when you know that the CME can raise margin requirements any time they please and drop the price by 10%+ in a day? (While they go short and make a killing along with those at the CFTC).   It's safer to trade AAPL or Amazon, etc...

The cartel will eventually want to make some $$$ going long at some time as they cannot control the LONG TERM trend which is up.  As long as worldwide countries race to debase, Silver will be a great investment for long term holders.

Tuesday, April 17, 2012

Gold and Silver stocks heading lower?

As if they aren't low enough, Gold and Silver stocks are at a multi year low based on the ETF GDX.  The GDX is similar to the HUI and XAU as it contains large to mid cap Gold and Silver stocks.

Here is a one year chart of the returns for GLD (representing Gold) and the GDX:


Gold has a 15% return and the GDX has a -21% return.

Here is a 5 year chart of the returns for GLD and GDX:


Gold has a 136% return and GDX has 11% return.  Why hasn't the Gold and Silver stocks kept up with the bullion?  Some say that the ETF's are to blame as they do not carry the high risk that the miners have.  Some may believe that Gold has hit a top and will only go down from here, so why invest in a Gold miner?

Physical metals are taxed as a collectible and at a higher rate (28%) than selling a stock / bullion ETF. Excerpt taken from Groco.com

Calculating Capital Gains Tax on the Sale of a Collectible

Uncle Sam takes a tax bite out of almost every asset sold and collectibles are no exception. Indeed, collectibles are currently subject to one of the highest rates of federal taxation on investment property. Capital gain from the sale of a collectible is taxed at 28 percent.
Here is the GDX divided into Gold bullion over the past 3 years:

You can easily see that the Gold / Silver stocks have significantly under-performed the physical bullion.  Some may say that it's best to only purchase physical bullion and that any paper asset is asking for trouble. As Rick Rule has mentioned in past seminars (Like the SF Hard Assets that I went to last November), you want to buy items when they are on sale, not at retail price.  
One way to approach the miners is accumulating a position in the GDX to spread out risk.  It is hard to pick the exact bottom or top, so dollar cost averaging into the ETF would be a good way to go if one believes that the miners will rally at some point in the future.

Sunday, April 15, 2012

Gold Silver Ratio mid April

Like Gold and Silver, the ratio is also in a large trading range which does not look like it is gong to make a significant move one way or another.  That is until a catalyst of some kind moves one of the metals while the other is stagnant.


The ratio is above the 50 and 200 day moving average - Bullish
Even though it has been in a trading range since last October, it is on an ascent - Bullish
It is overbought on the Slow Stochastics indicator - Bullish if it should embed, otherwise, Bearish.

Looks like some heavy resistance near the 58 level which was a low point in September 2010. (Green line)

There is not too much exciting here, the ratio may continue this trading range until fall and the 'seasonals' come into play.  (If they do this year).

Friday, April 13, 2012

Silver Manipulation.....?

There can't be any manipulation in the Silver or Gold market, the U.S. has the CTFC to regulate the futures markets.  (And what a fine job they are doing!) The U.S. also has the SEC to monitor the financial markets, Martha Stewart knows what will happen when a little insider trading happens...

Here is a video of some nice people from the banking sector and quite a bit of data regarding the price of Silver over the last few years...


Thursday, April 12, 2012

SMX to launch gold, silver contracts based on Indian prices

Another Gold and Silver Exchange?  Looks like Singapore want's to start 'playing' the Gold / Silver trading game. I haven't heard very much about the Pan Asia Gold Exchange lately, but I haven't done any research on it either. Having 'independent' exchanges around the world may not be beneficial to the cartel's stranglehold on the short term prices.  I'm sure they would not want Singapore to start this exchange which may start other countries to do the same.

Singapore Mercantile Exchange (SMX), which is backed by Financial Technologies (India), today said it will launch gold and silver contracts based on Indian prices for the global market next month.
SMX E-Gold would offer a convenient trading unit of one kilogram to be traded based on gold future prices in India but quoted in US dollars, SMX said, adding it would be launched on May 8.
SMX E-Silver would trade in 30-kg lot based on silver future prices in India but quoted in US dollars, said SMX.
Both contracts would be cash settled against the benchmark Gold and Silver futures contracts in the East, it said.
"Both contracts are similar to those traded on Multi Commodity Exchange of India (MCX), the sister exchange of SMX," said SMX, chief executive officer, V Hariharan.
"We are introducing the same contracts from our sister exchange in India to the global market in US dollars," he said.
He said SMX would consider launching MCX's other successful contracts for the global market as part of its expansion plans.
Participants in the SMX E-Gold and SMX E-Silver would be able to use and benefit from pricing in the most liquid Gold and Silver futures contracts in Asia, said SMX.
The participants would be able to hedge their exposure based on one of the most liquid precious metals futures and physical market and link hedging to other similar contracts in the world.
Meanwhile, SMX has launched a campaign to expand its trading members, and increase the membership options.
It has started offering transferable, non-transferable and associate trade membership, replacing its existing single category of trade membership.
Jignesh Shah, Vice-Chairman, SMX said, "The new membership offerings will spur entrepreneurship and are aimed at attracting the new generation physical and OTC commodity traders to the futures market to hedge their risks."

Wednesday, April 11, 2012

Eric Sprott Interview on Martin Ellis

Both Gold and Silver and still floundering in their 'large' trading ranges and may continue for some time until some type of catalyst occurs.  (Like the bullion banks want to make fiat going long before they short the crap out of them again).  In the mean time, here is an interview from Eric Sprott.   Just stay long and don't let the PM bear market and consolidation affect your investing psychology.