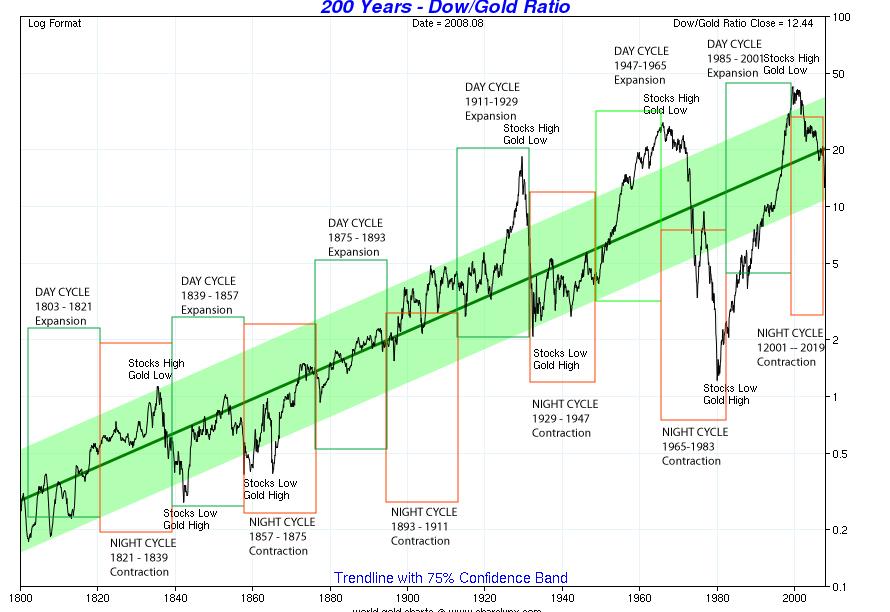
You can see that there is a upwards trend in the green outlined channel. Since 1900, the ratio has come down to 1/1 in 1980. (Gold and the Dow was ~800). The Dow is currently around 9700 and Gold around $1200, that makes the ratio at 8.08. (It takes 8 ounces of Gold to equal the Down index).
A ratio of 8 is below the lower green trend channel which suggests that we may see a lower ratio going forward (The ratio trend is in downwards path). Based on the chart, the ratio has only pierced the green channel 3 times over the past 200 years.
What does this suggest? Keep your eye on this ratio as the Gold bull run will most likely continue over the next several years. If Gold does appreciate and the Dow fluctuates around the 10k level as it has over the last 10 years, we may see close to a 3/1, 2/1 Dow ratio within a few years.
3/1 - Gold at $3,300 and the Dow at 10,000
2/1 - Gold at $5,000 and the Dow at 10,000
No comments:
Post a Comment